Mapping with
the Eye
Fundamentals of spectral behavior — how satellites turn invisible energy into an image a person can read, and how that image can be trusted to say something about the land.
Remote sensing & geoprocessing, Federal University of Goiás
How can a tiger hide from its prey with such bright colors?
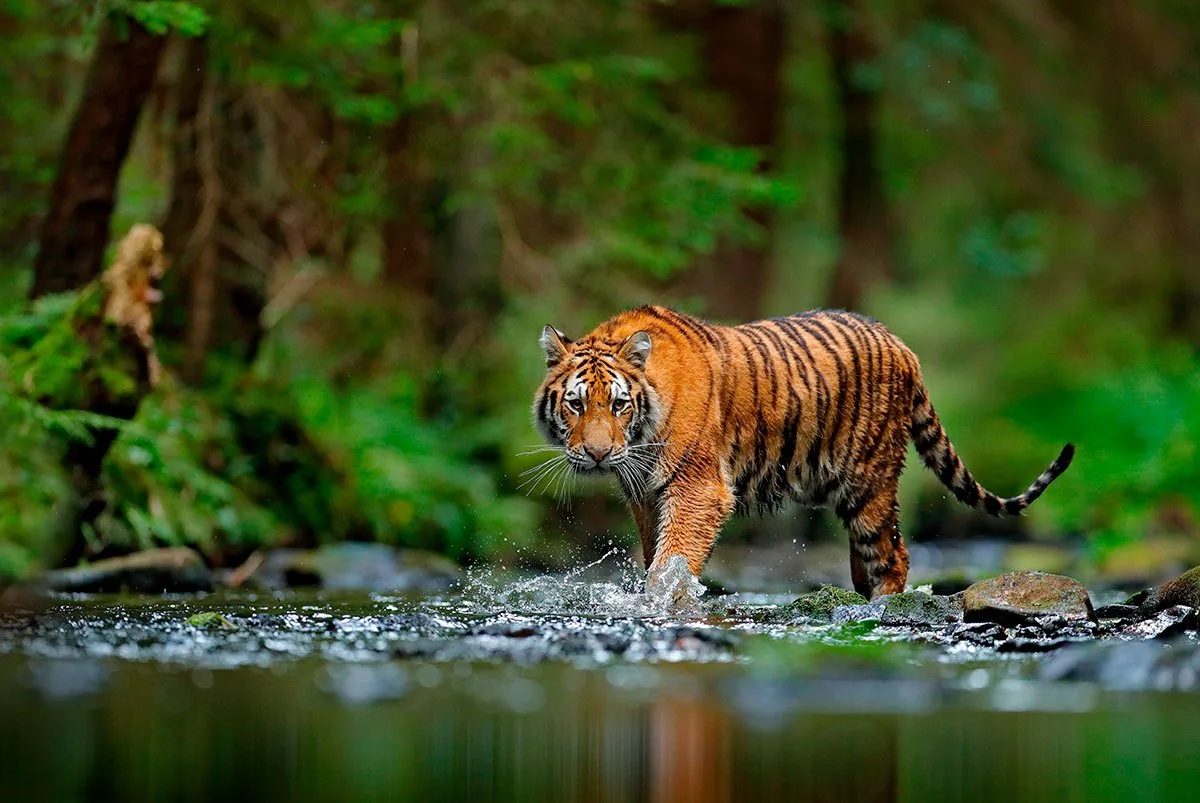
Because it is not orange — at least, not to the eyes of its prey.
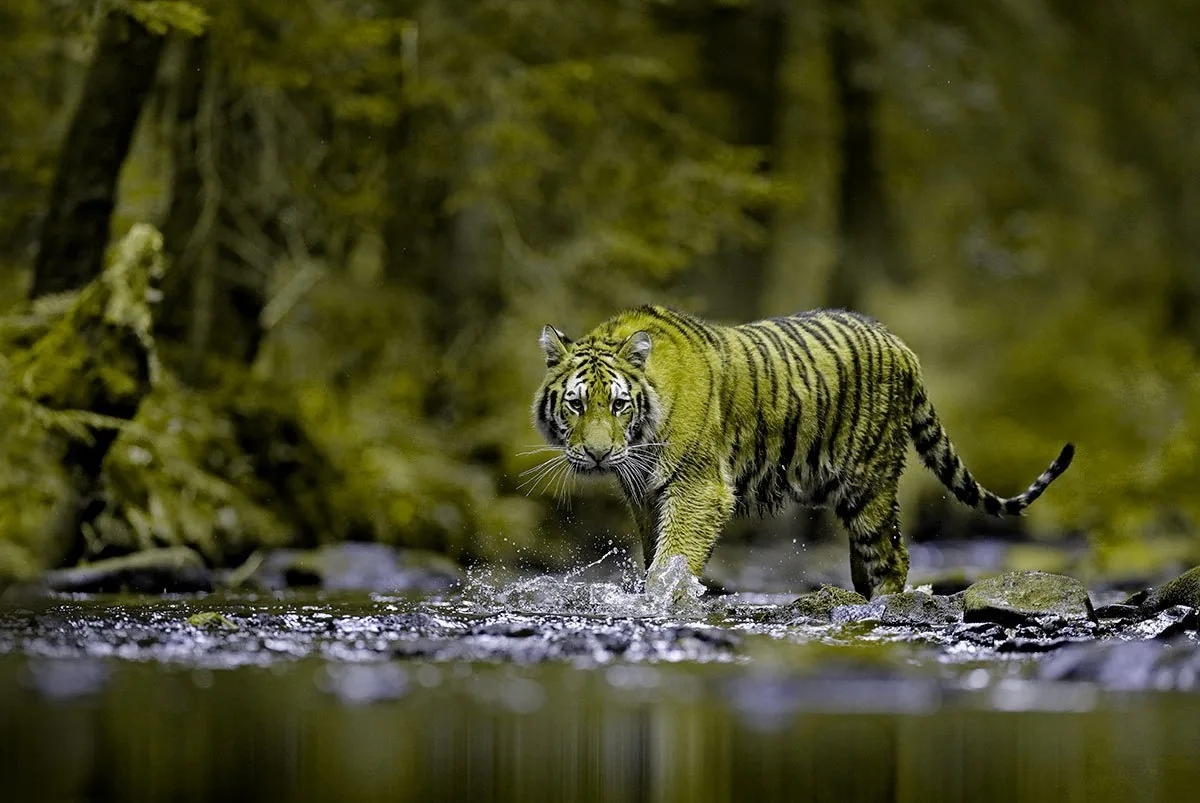
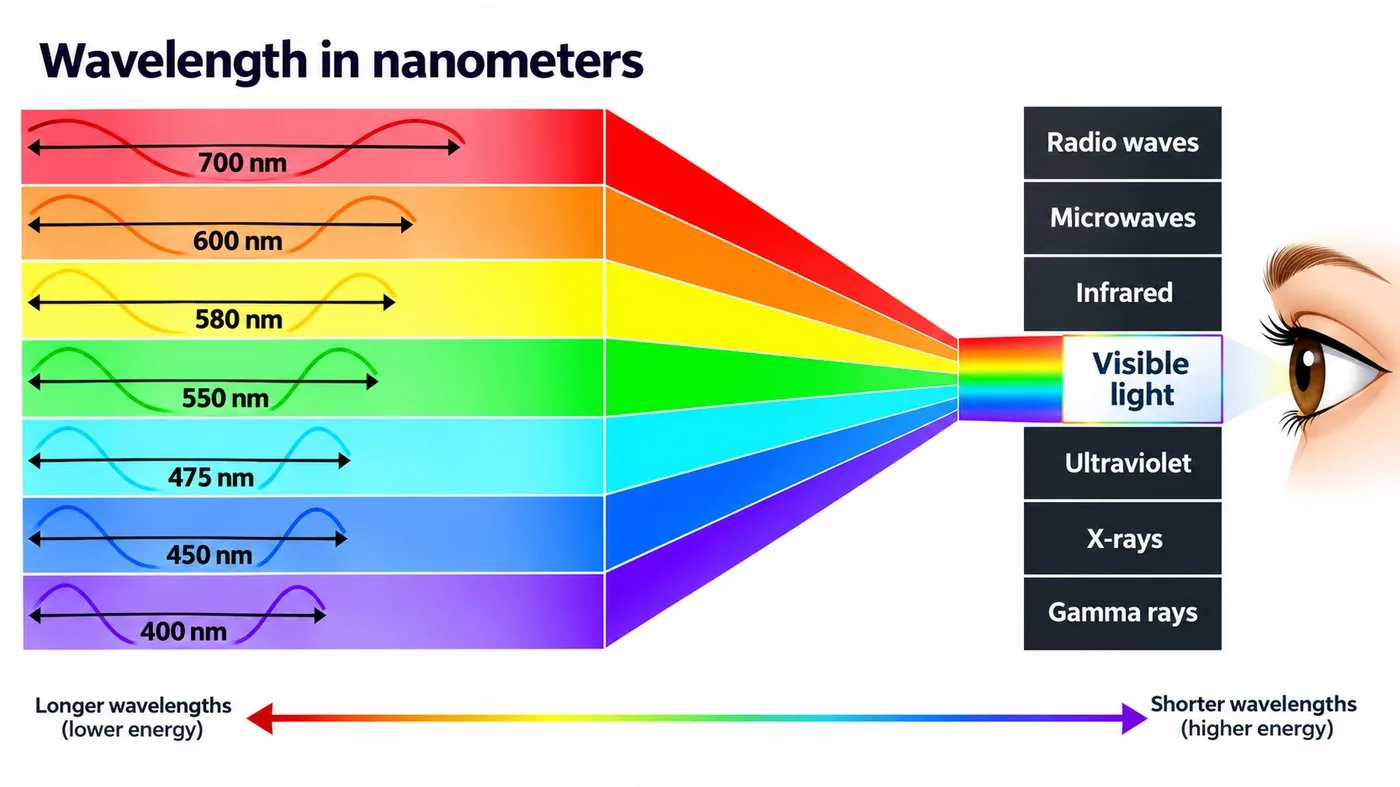
Color is how we perceive light energy
Different wavelengths of visible light are perceived as different colors — and many wavelengths, like infrared, are entirely invisible to us.
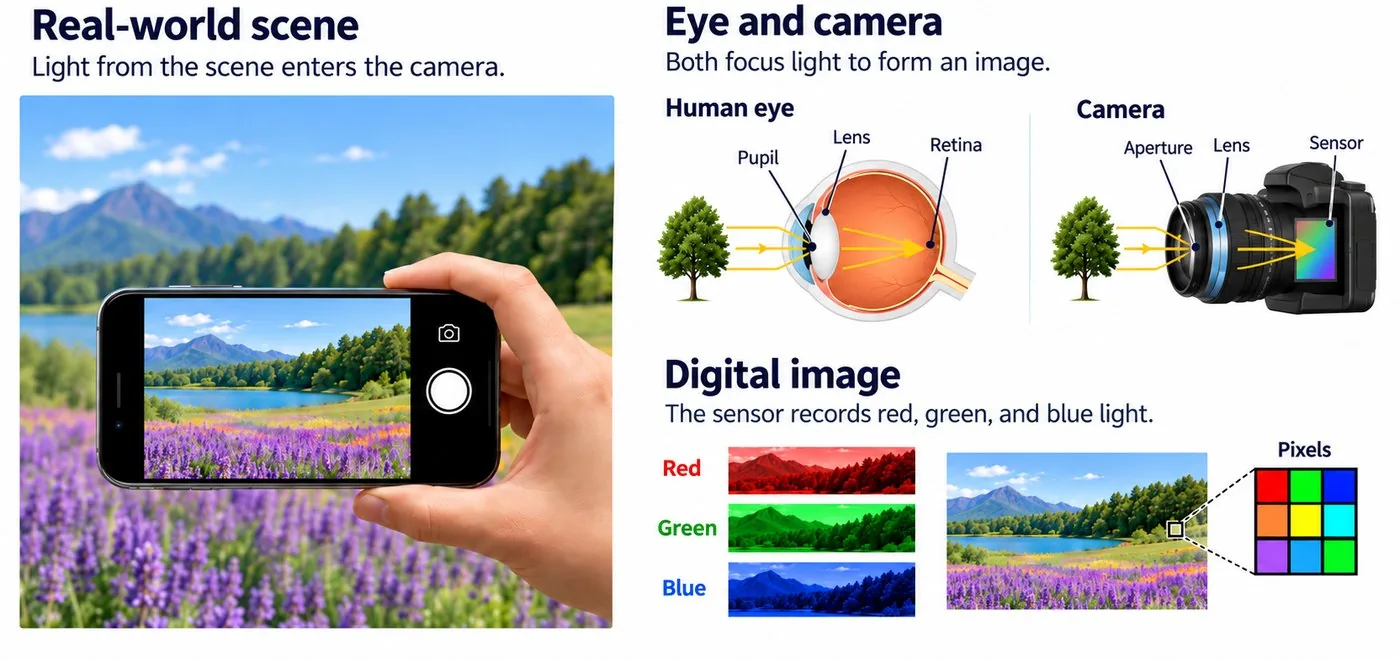
Cameras work in a similar way
They record light energy and store it in three primary colors — red, green and blue — which combine to recreate the scene.
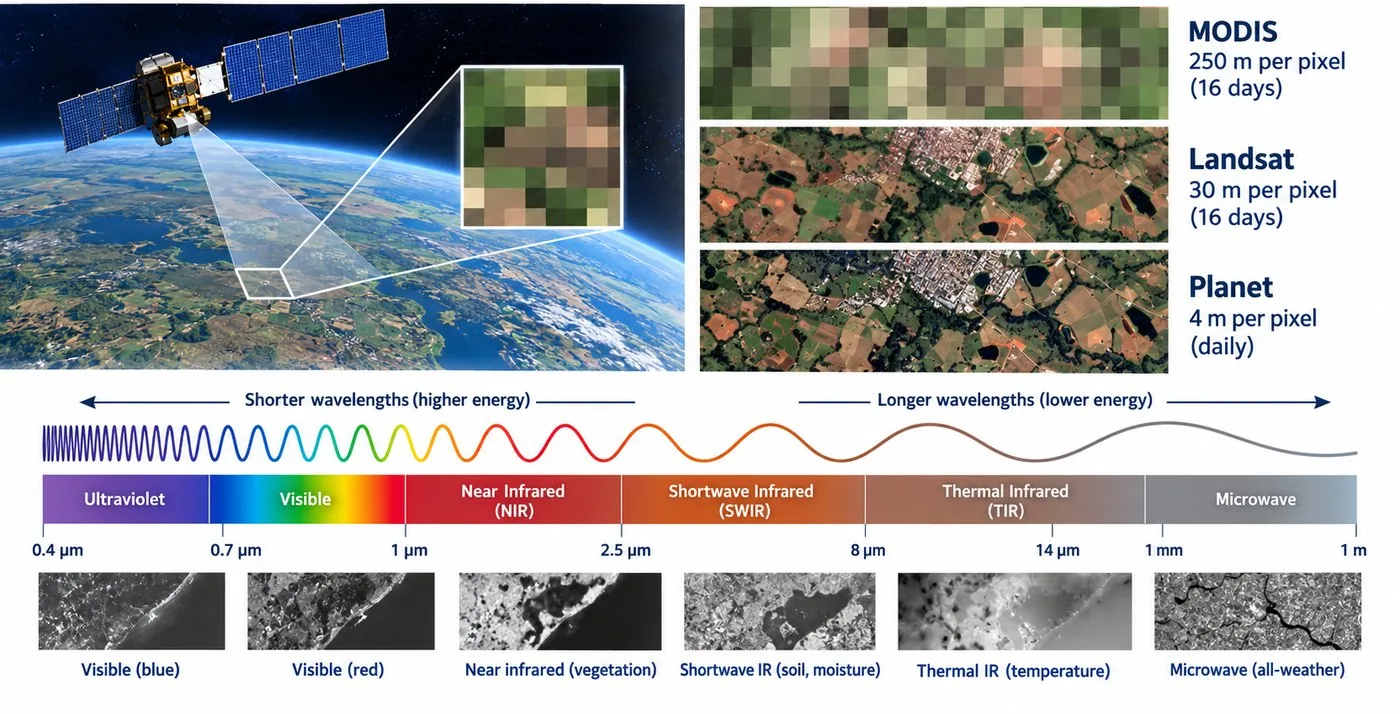
Satellites are like cameras in space
A satellite is a very large camera with a powerful zoom — one that can also capture wavelengths our eyes can't see, storing them in pixels of different sizes and spectral bands.
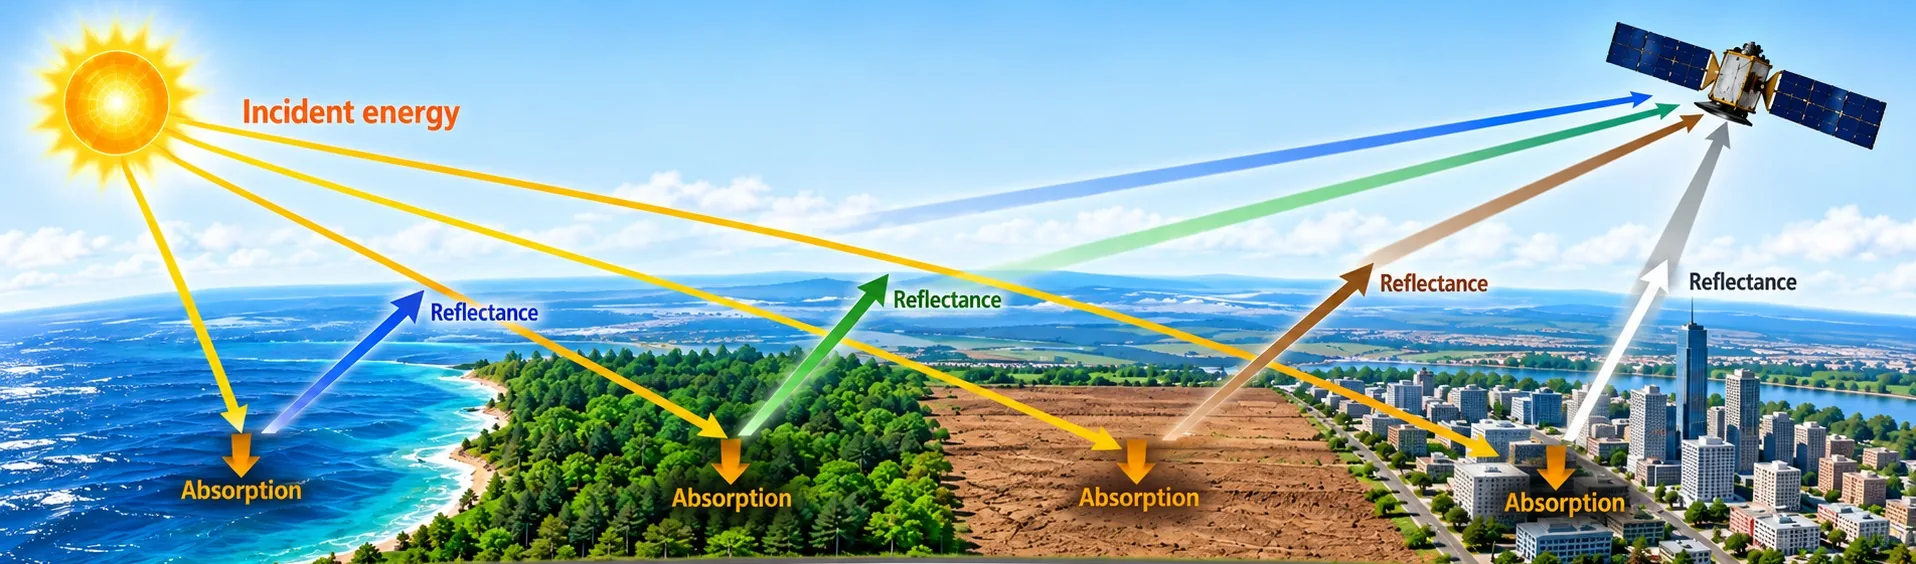
Where does this energy come from?
From the Sun. It sends energy to the Earth, and different objects absorb and reflect it in different ways.
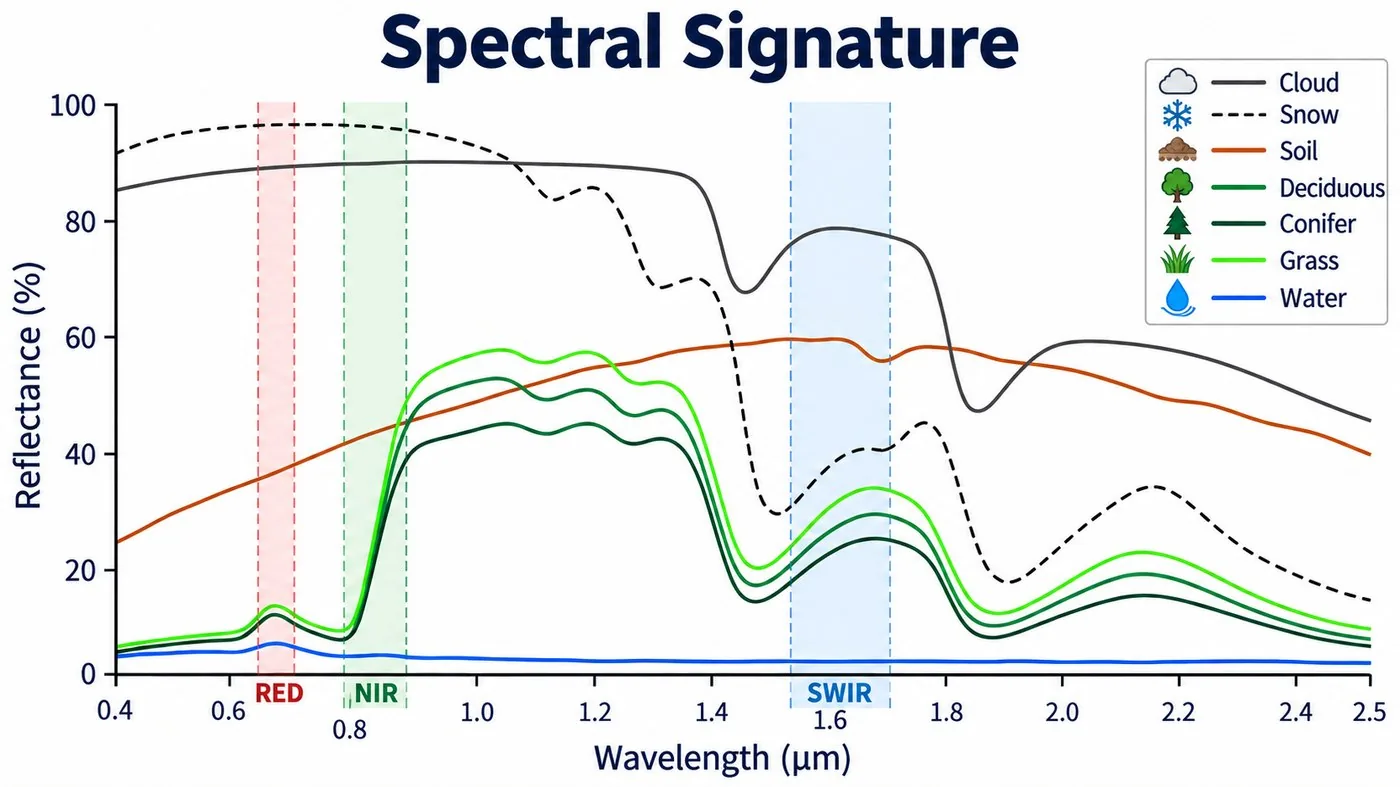
Spectral signature
Soil and vegetation are easy to tell apart, but the differences among vegetation types are much smaller — showing up mainly in the red, NIR and SWIR regions.
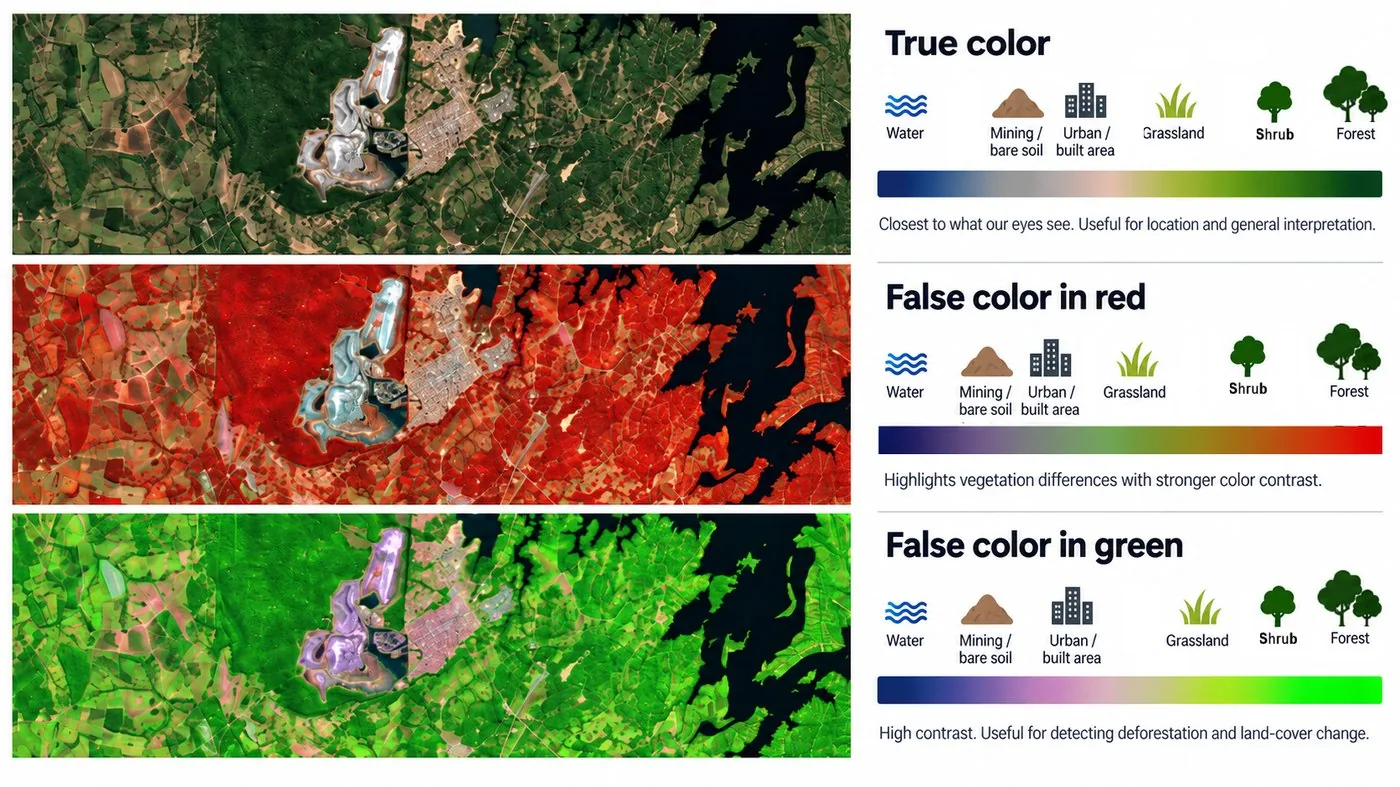
Color composites
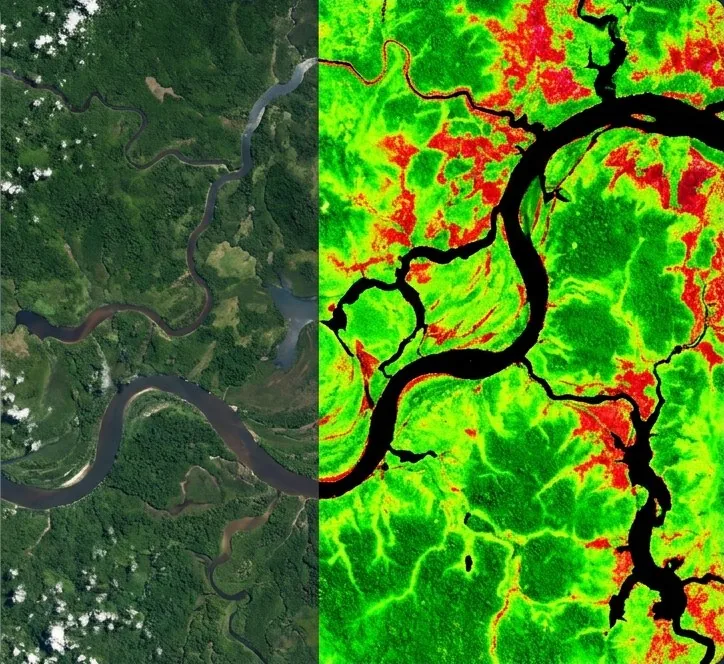
True color looks like what our eyes see. False color in red makes vegetation pop for easy differentiation. False color in green creates a strong contrast that makes deforestation easier to spot.
Visual interpretation is not just about color
What is this?
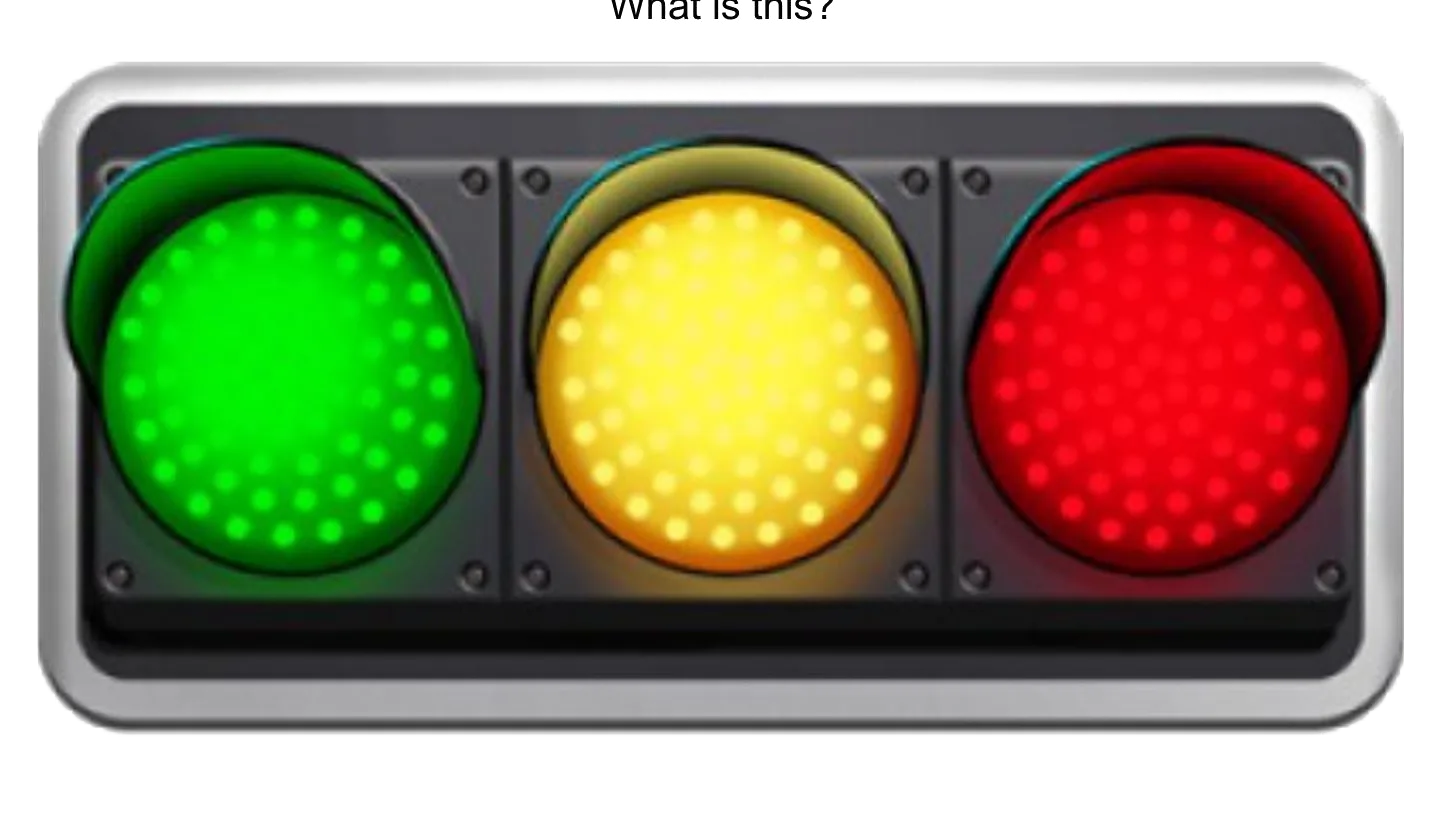
What colors do you see now?
If we put a cyan filter over the same image —
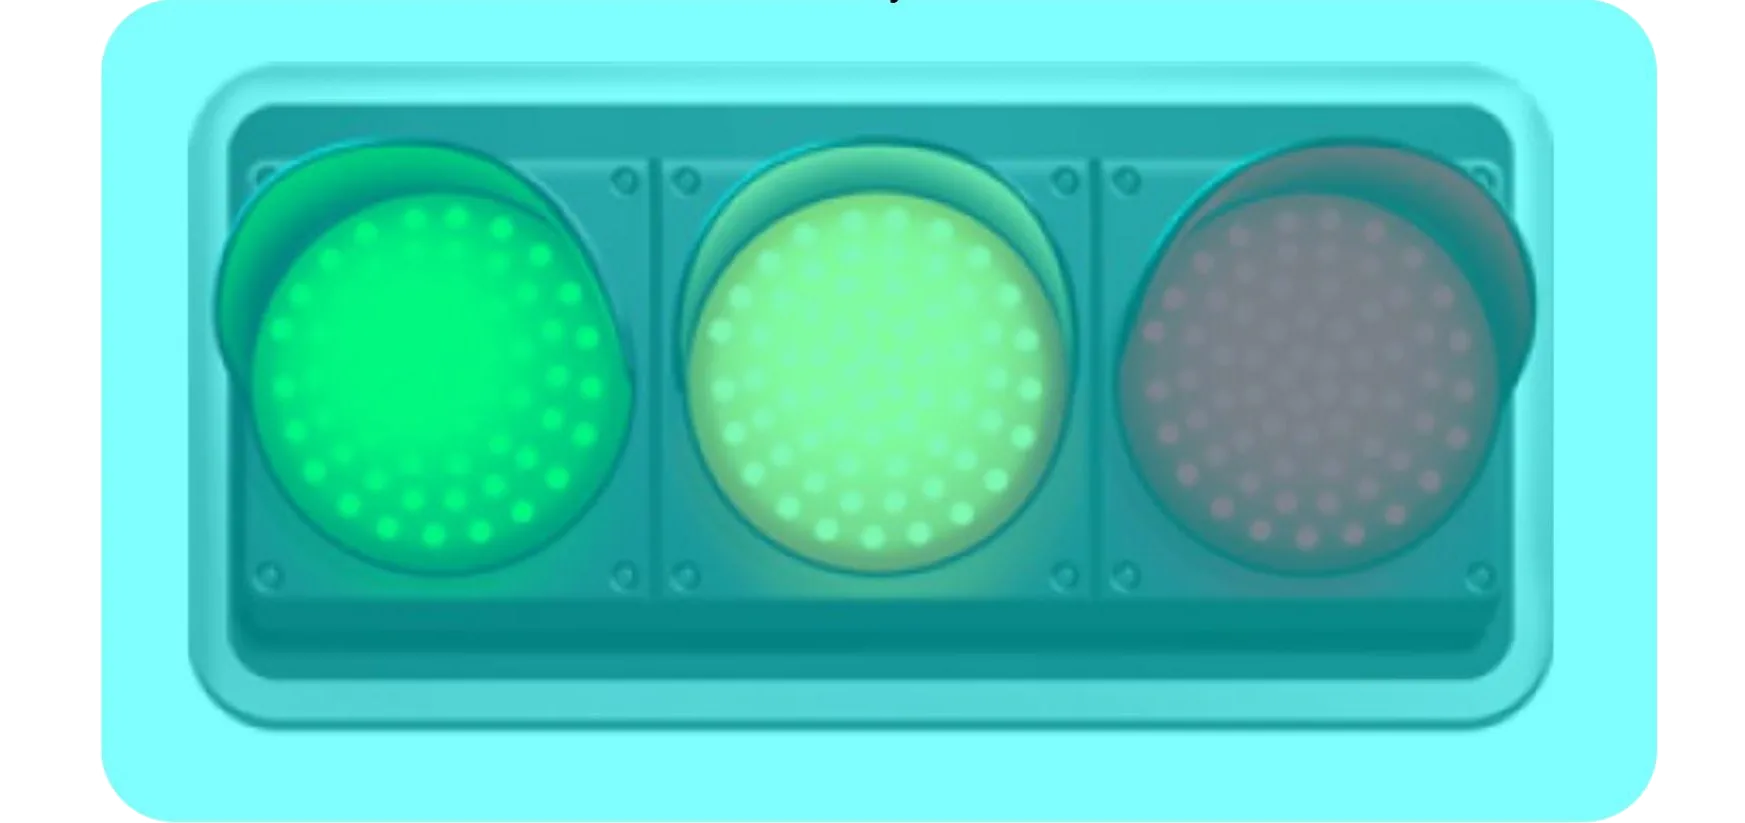
And what happens if we cover the rest of the object?
The actual colors are just two shades of green and gray. Our brain doesn't interpret color alone — it uses context and what it already knows, even when the image changes.

How do we do it?
Beyond color, visual interpretation uses six more techniques together.
 Color
Color Tone
Tone Texture
 Shape
Shape Context
 Spectral indices
 Temporality
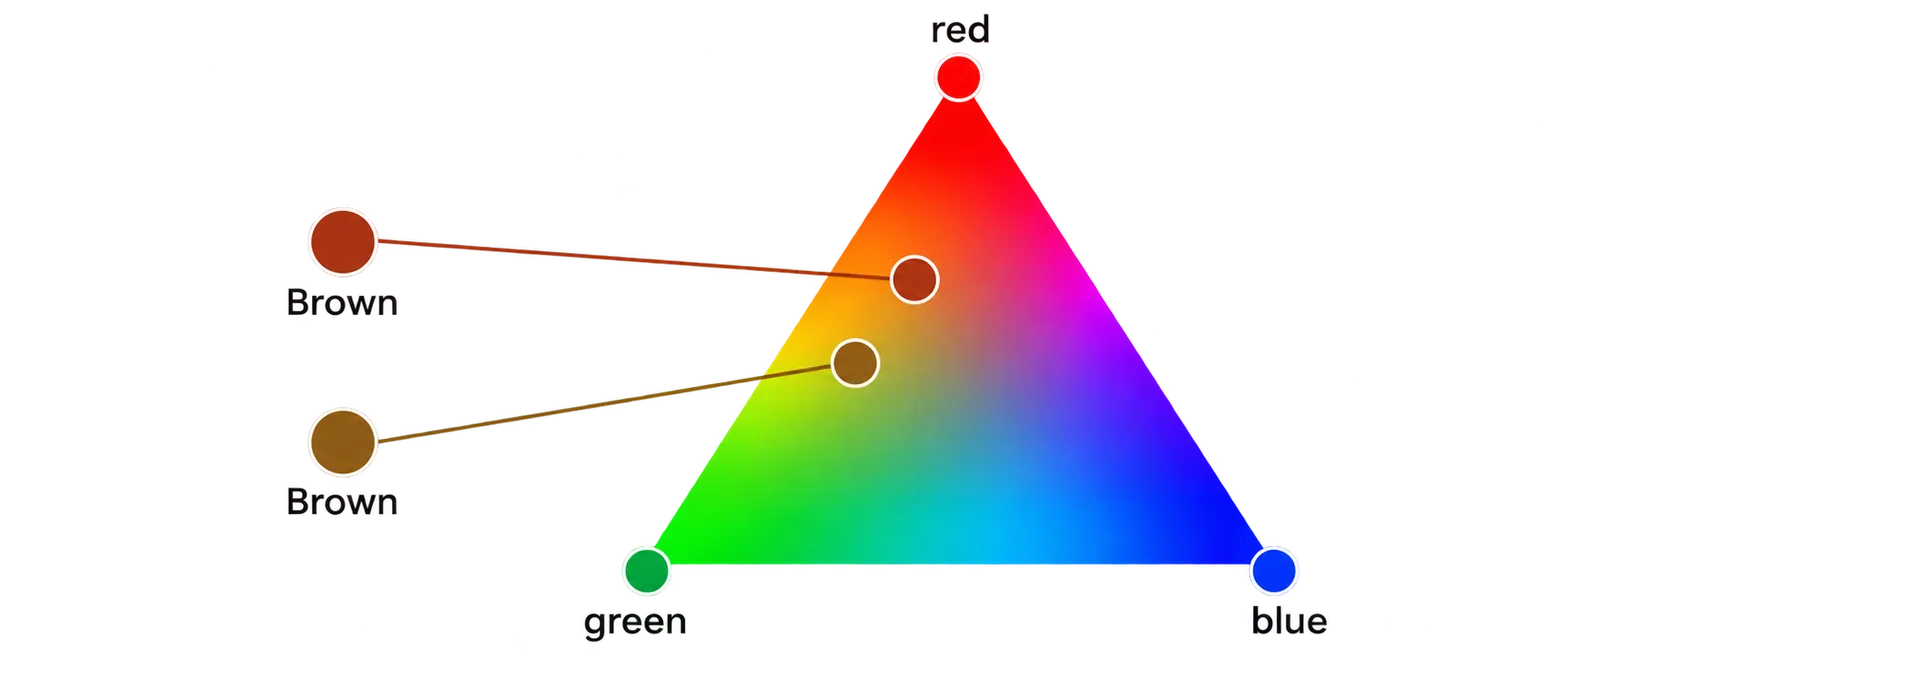
Color as a mix of the three primary colors
Two similar targets can have very close shades of brown — so we describe each one as a mix of two colors.
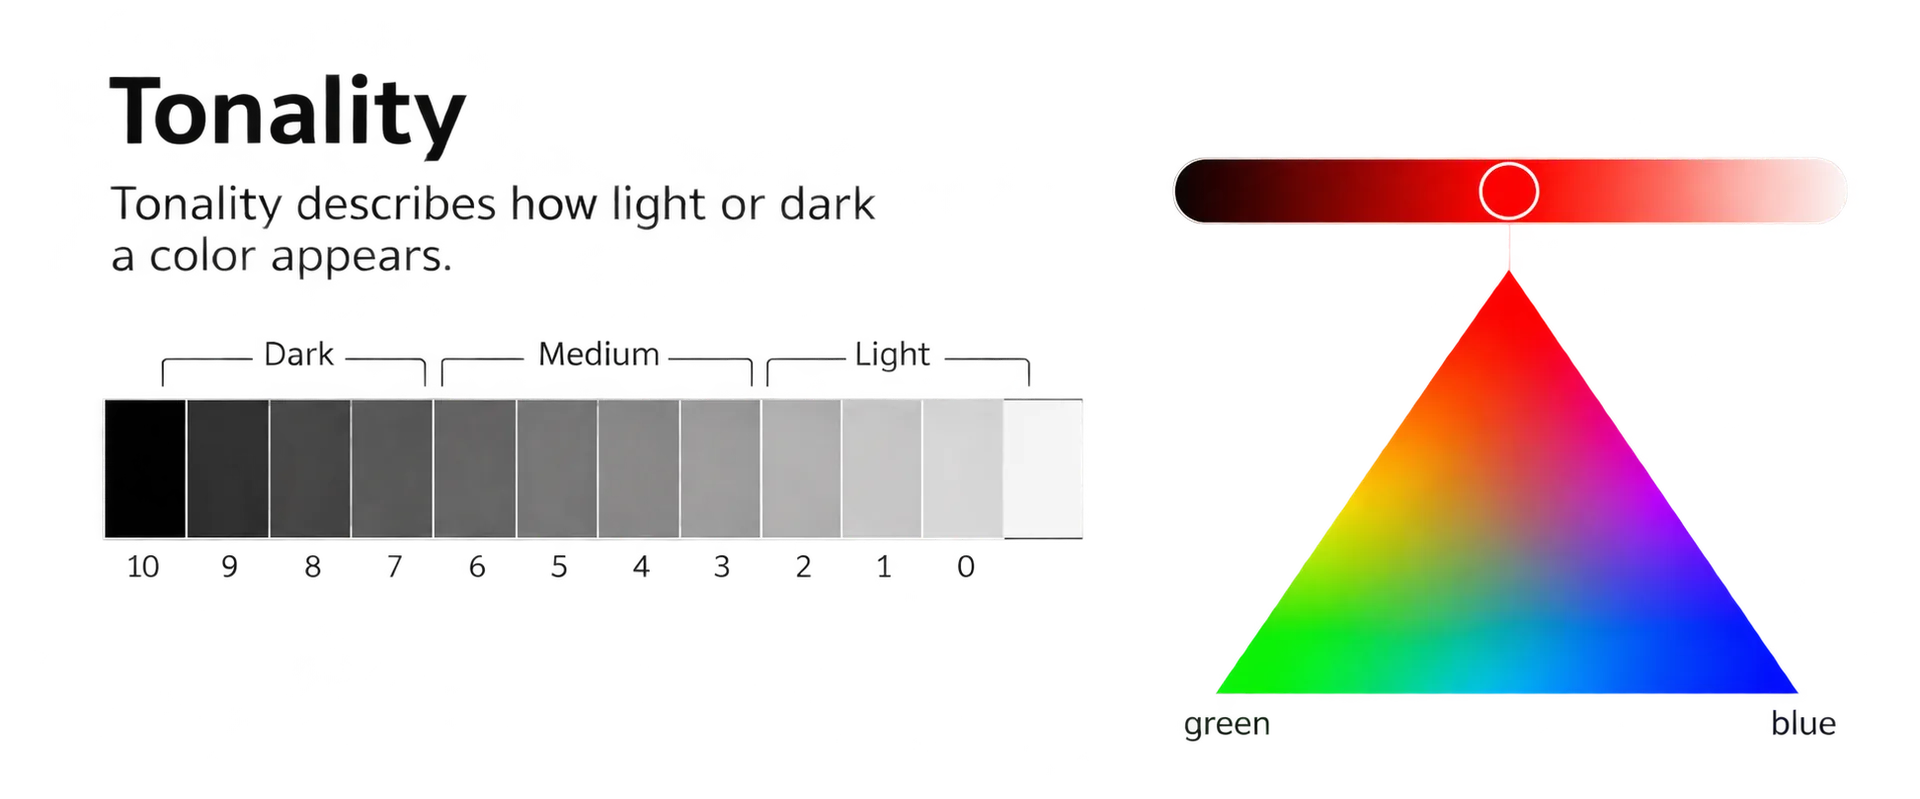
Tone is the amount of white or black mixed into a color
The same target can vary only in tone — with black it gets darker, with white it gets lighter.
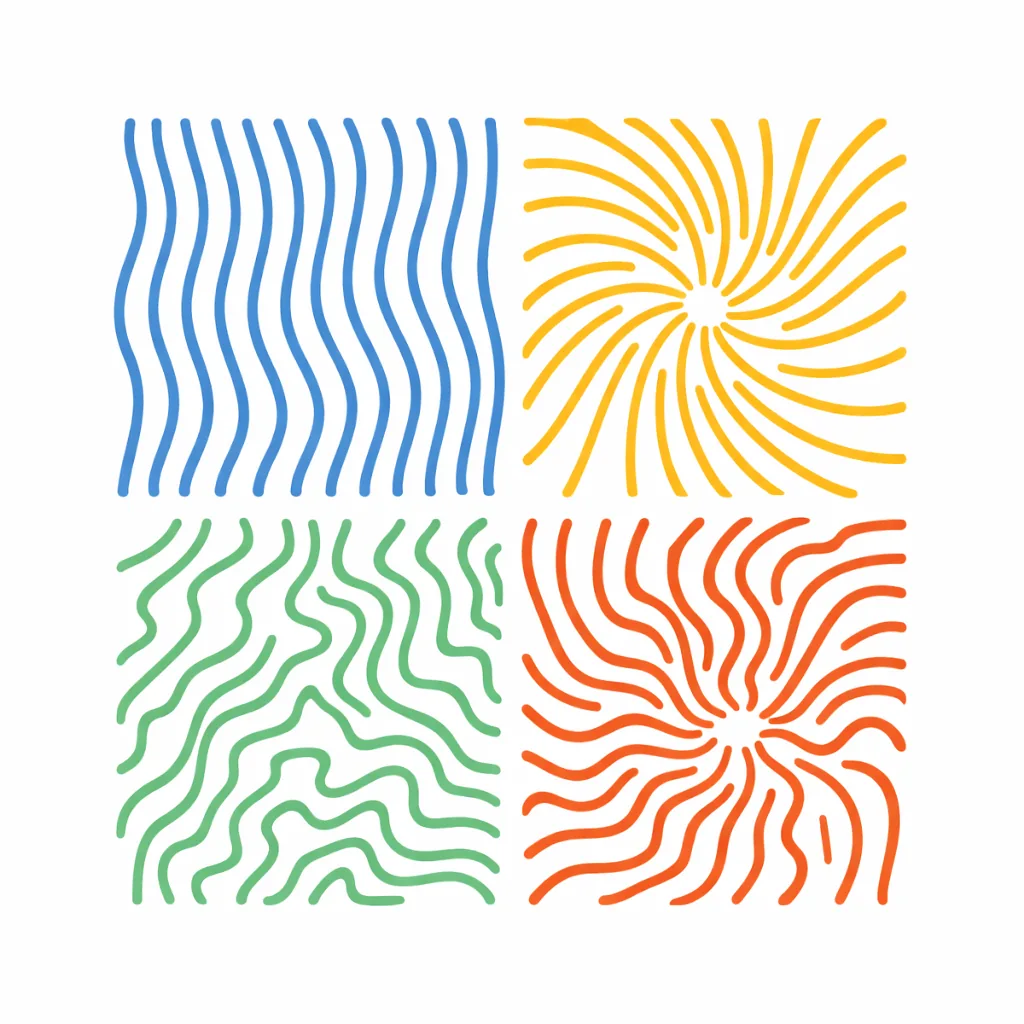
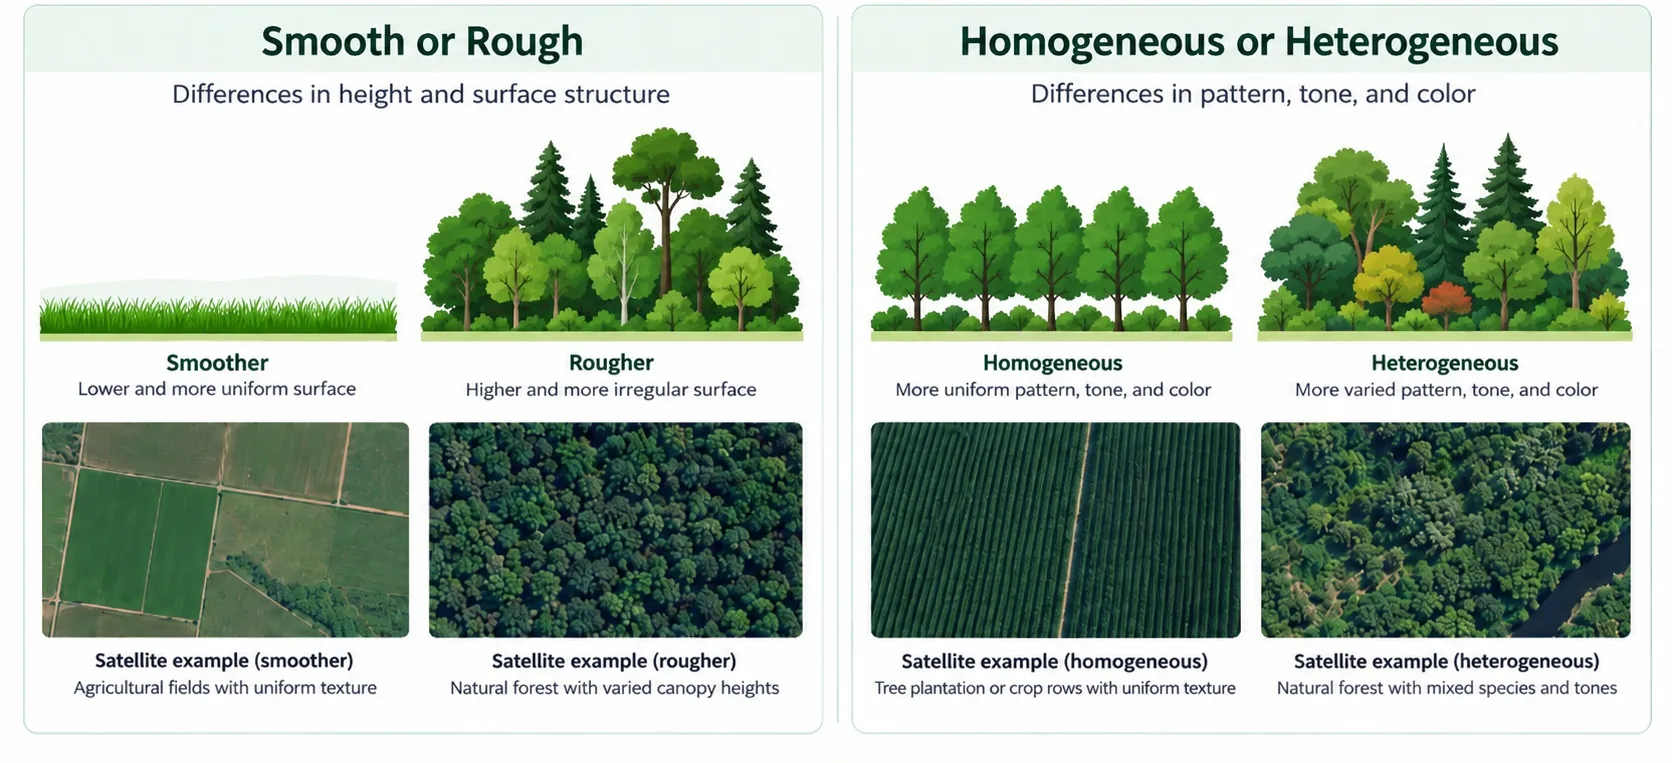
Texture splits into two axes
Smooth or rough describes height differences on the surface; homogeneous or heterogeneous describes the tone variation across it.
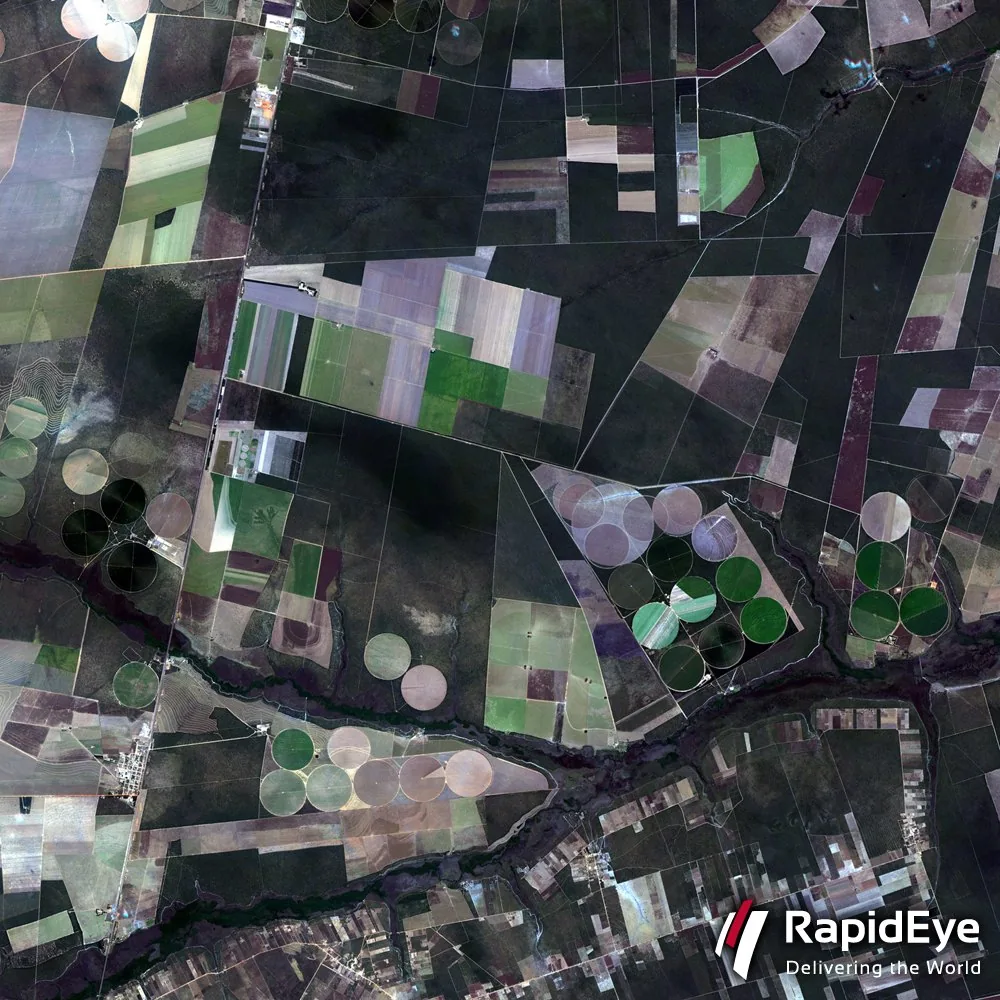
Shapes are clues of human alteration
Anthropized areas tend to have well-defined shapes; natural areas tend to have organic shapes.
Context means understanding the location
A patch with an exposed-soil color, seen in a context of deforestation, reinforces the hypothesis that vegetation was removed there.
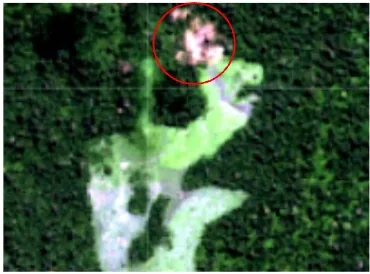
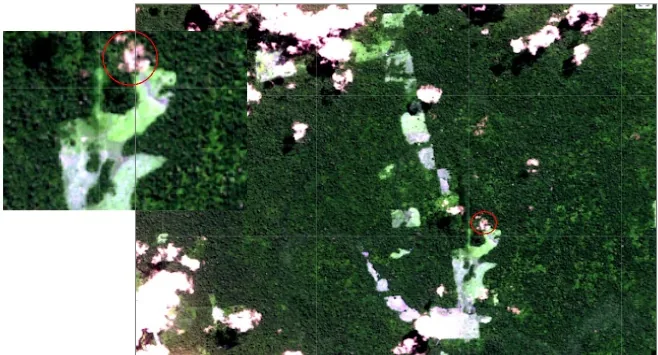
But context can change everything
By expanding the observed area, we notice several other identical patches — which are actually clouds, not exposed soil.
Vegetation indices and temporality
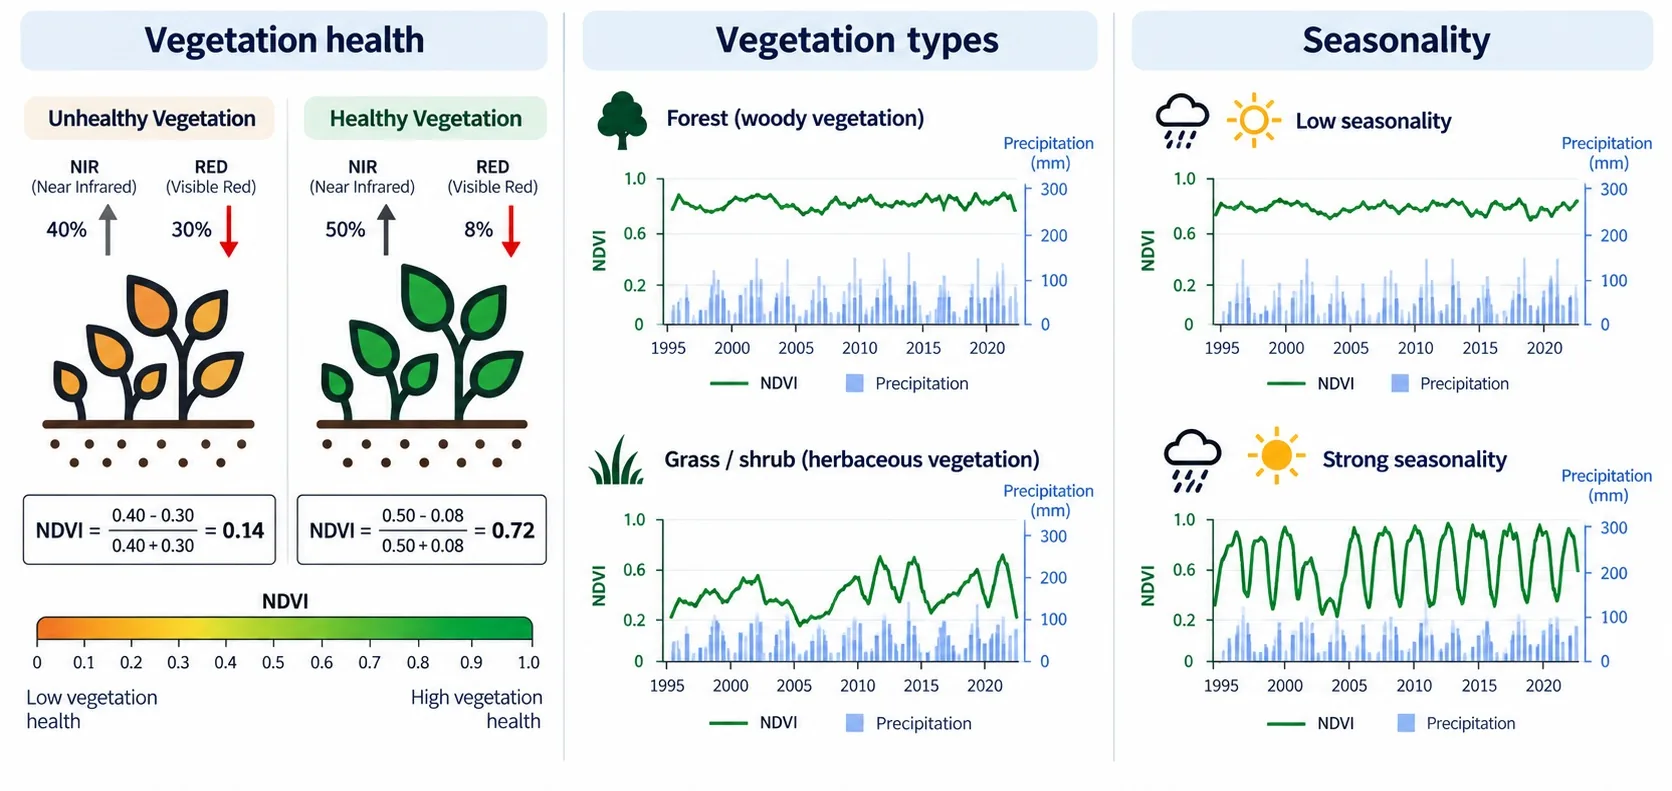
NDVI can measure vegetation health, differentiate vegetation types and reveal seasonality — deciduous vegetation loses its leaves in the dry season; evergreen does not.
Degradation
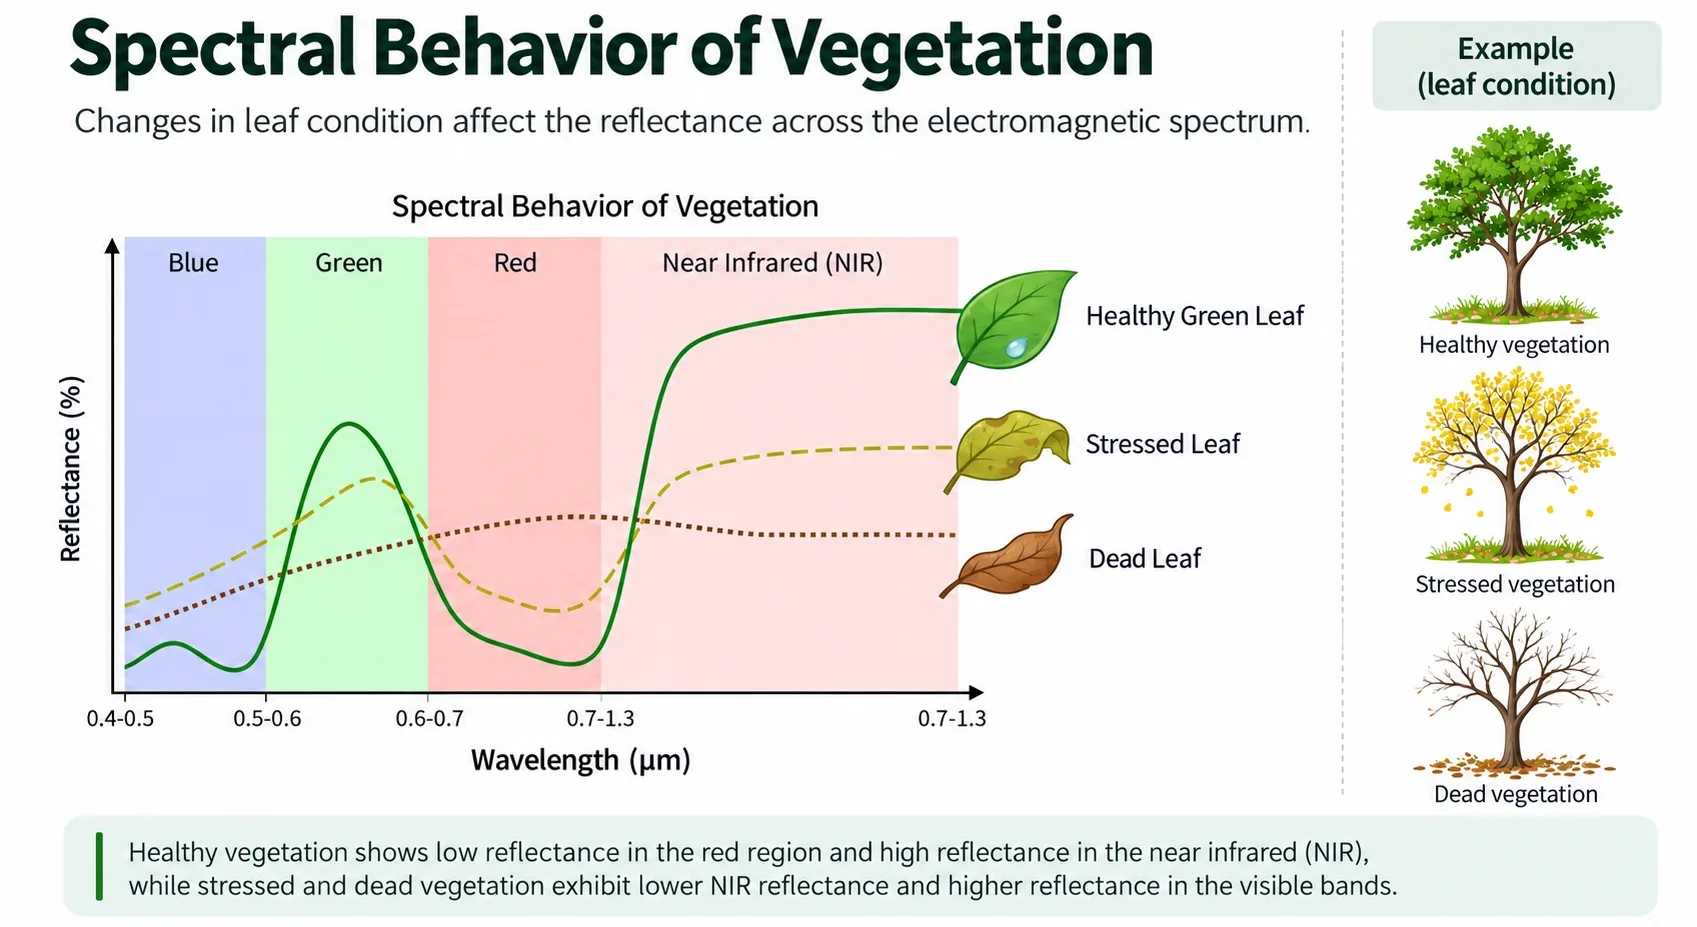
The spectral behavior of vegetation changes as it degrades, from a healthy green leaf to a dead leaf.
Deforestation and regeneration
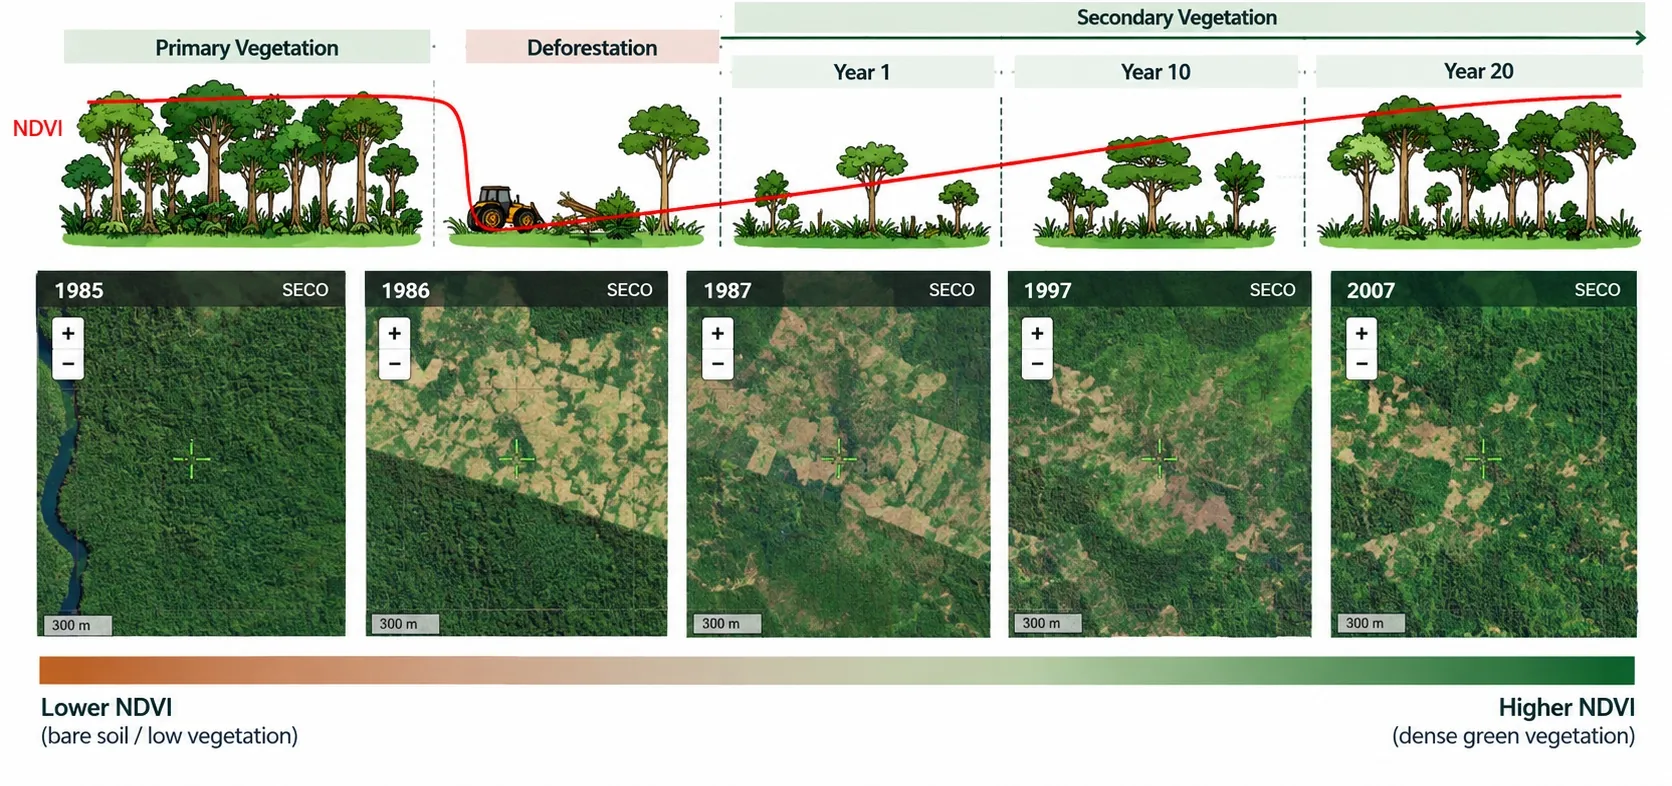
NDVI over time reveals the moment of deforestation and the regeneration process that follows.
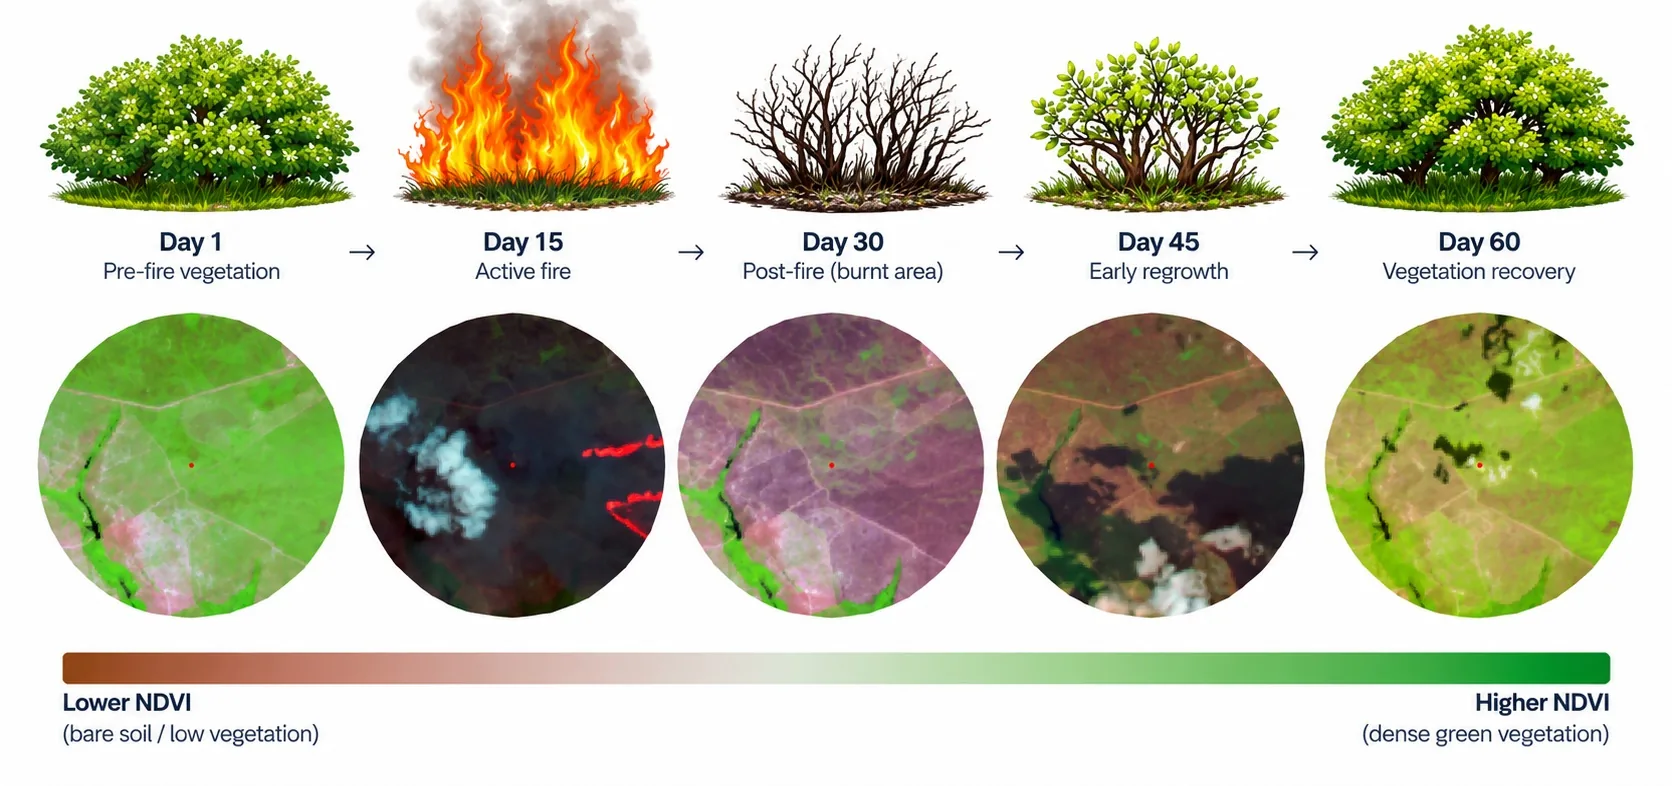
Fire scars
NDVI drops abruptly right after a fire and gradually recovers over the following days — from day 1 to day 60.
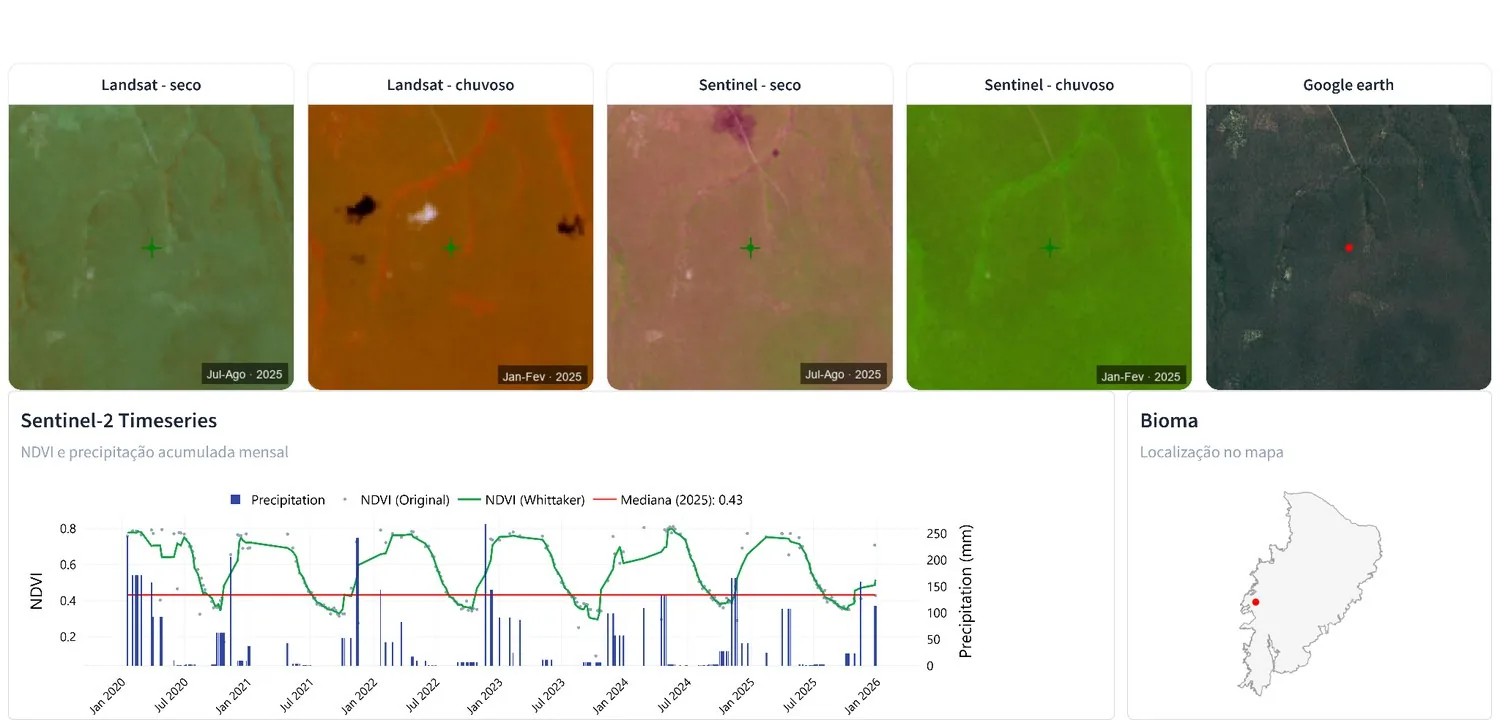
Forest Formation
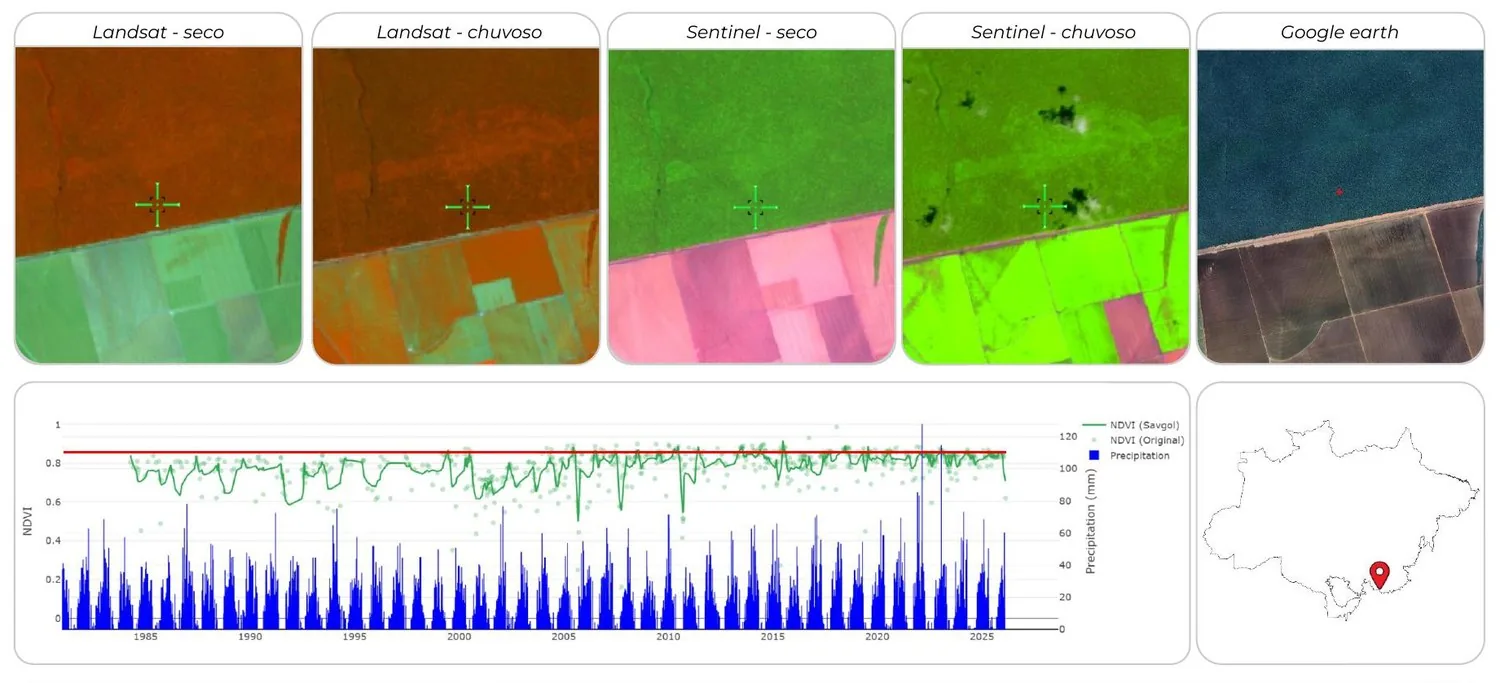
Forest Formation
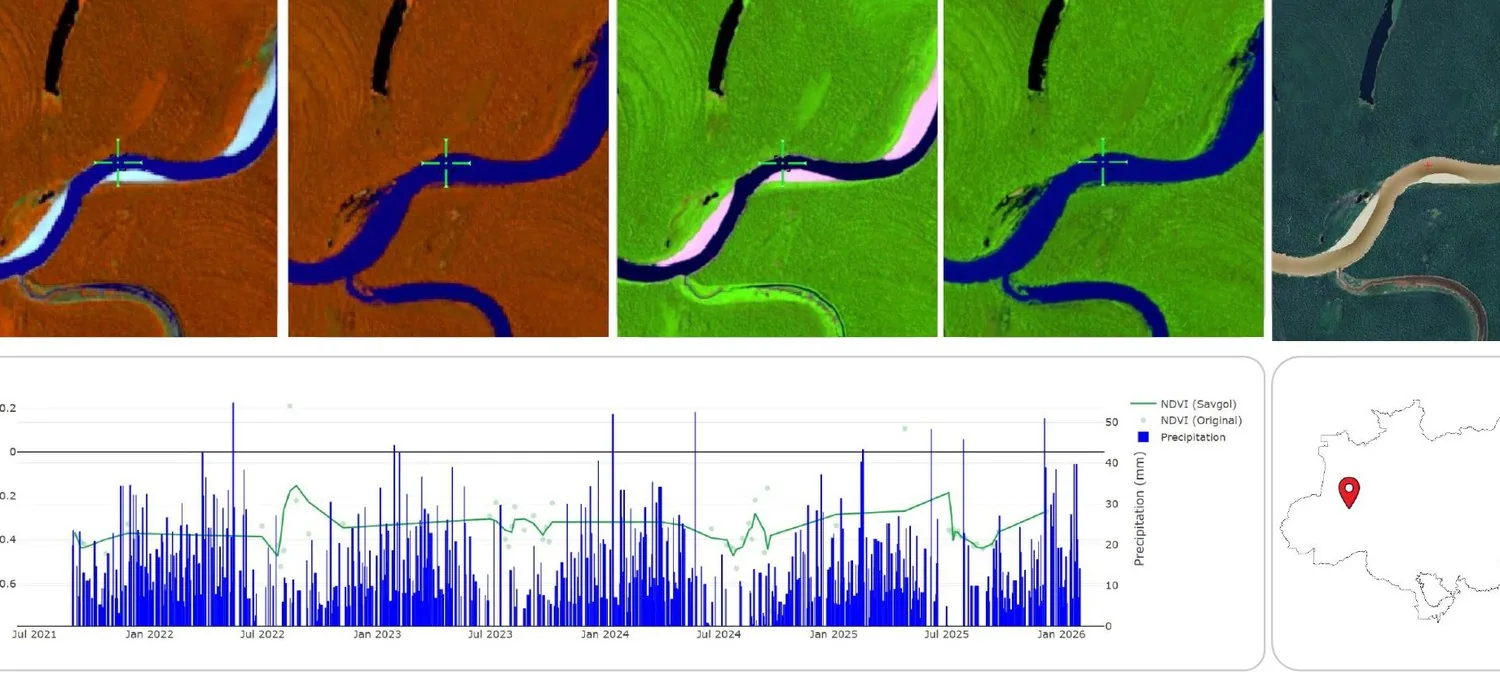
River, Lake and Ocean
Savanna Formation
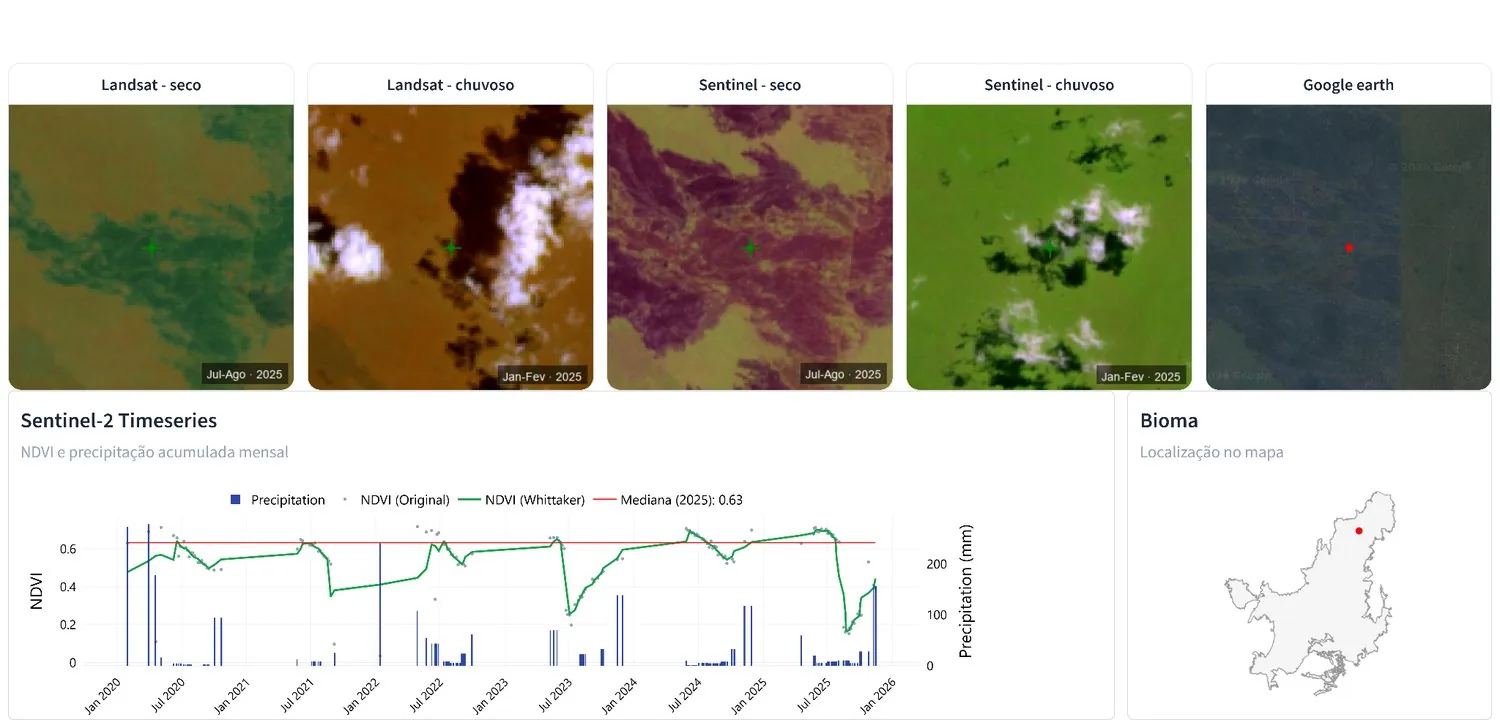
Savanna Formation
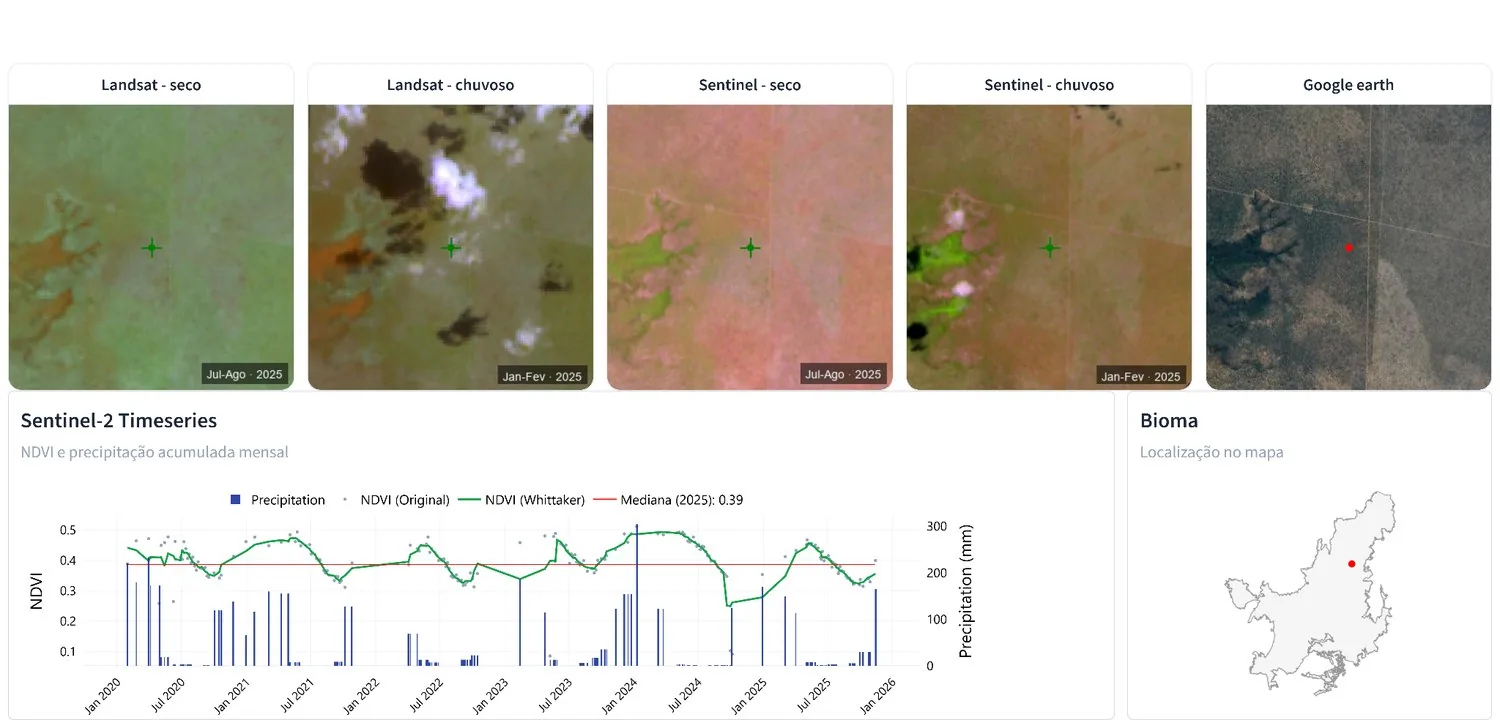
Grassland Formation
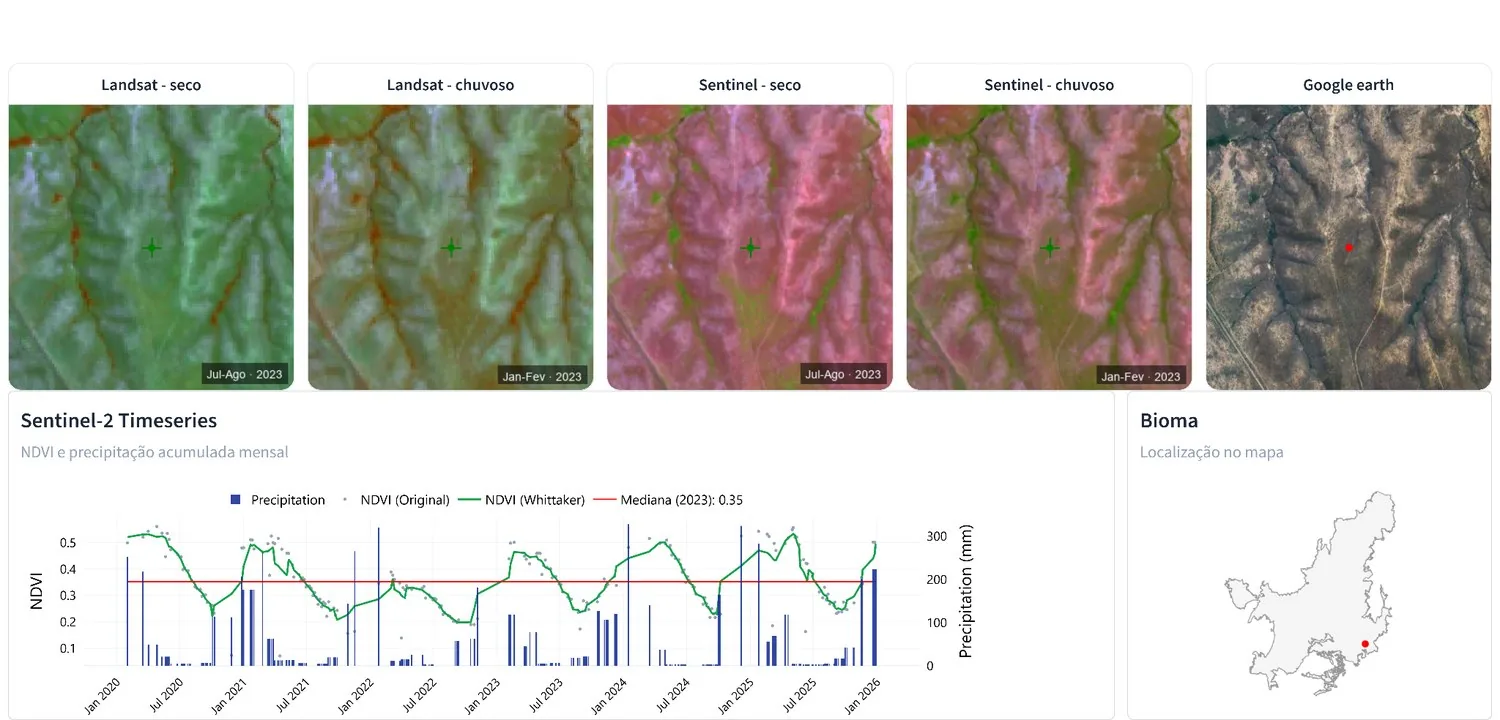
Temporary Crop
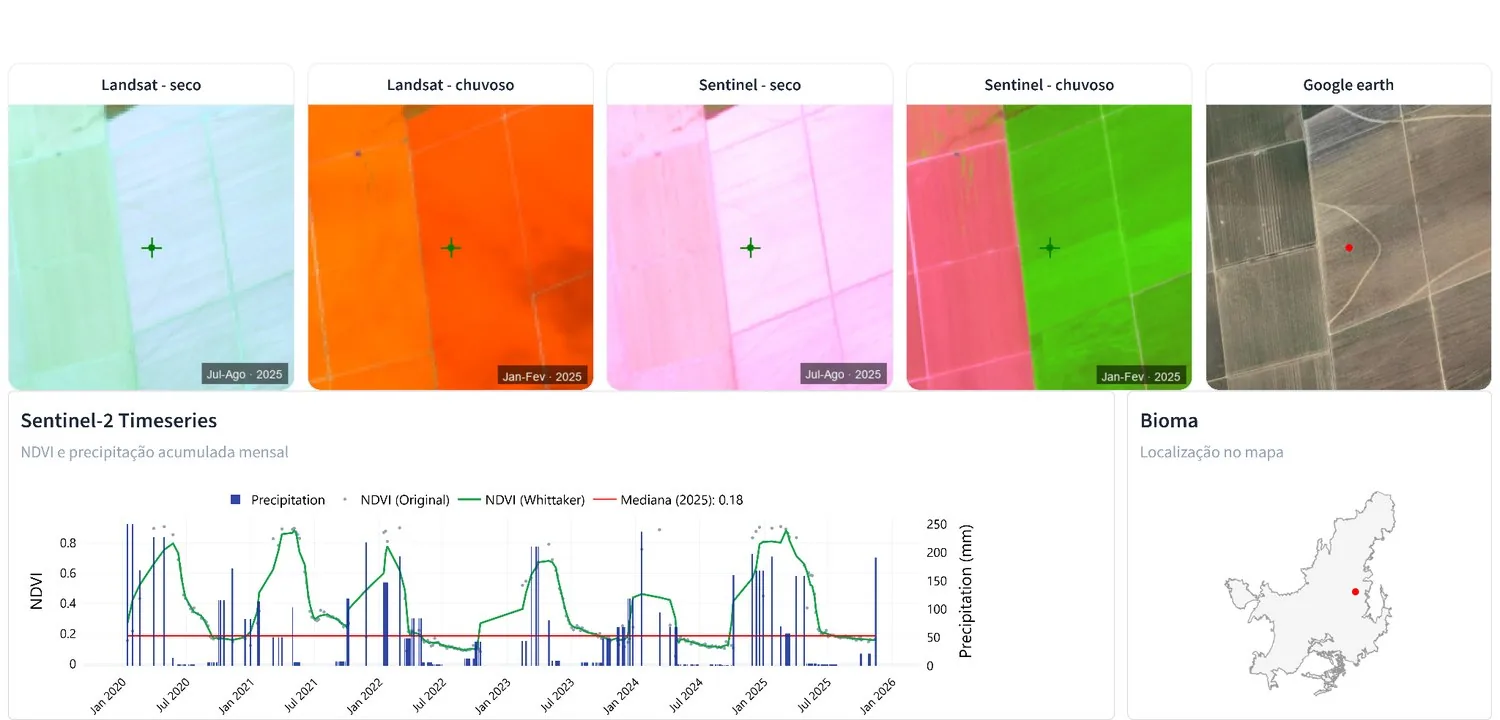
Silviculture
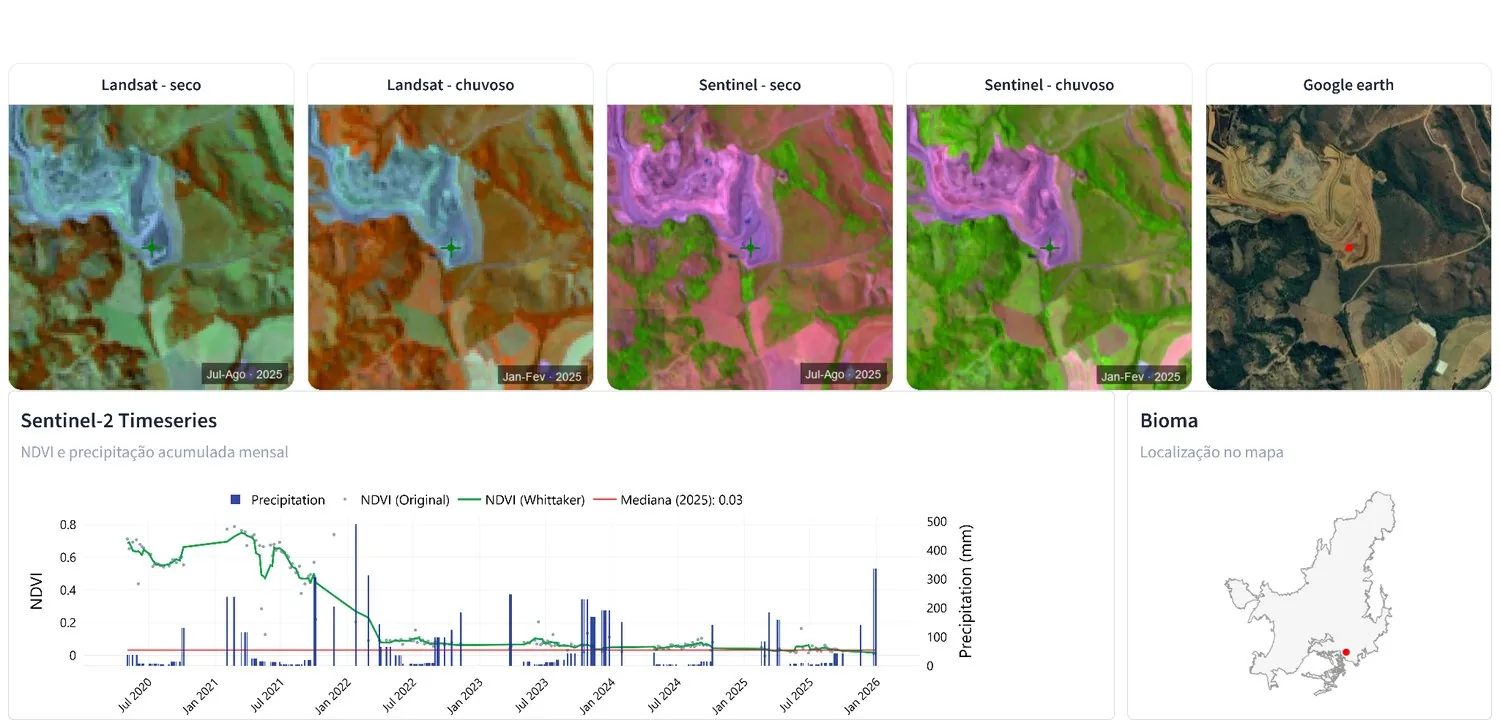
Mining
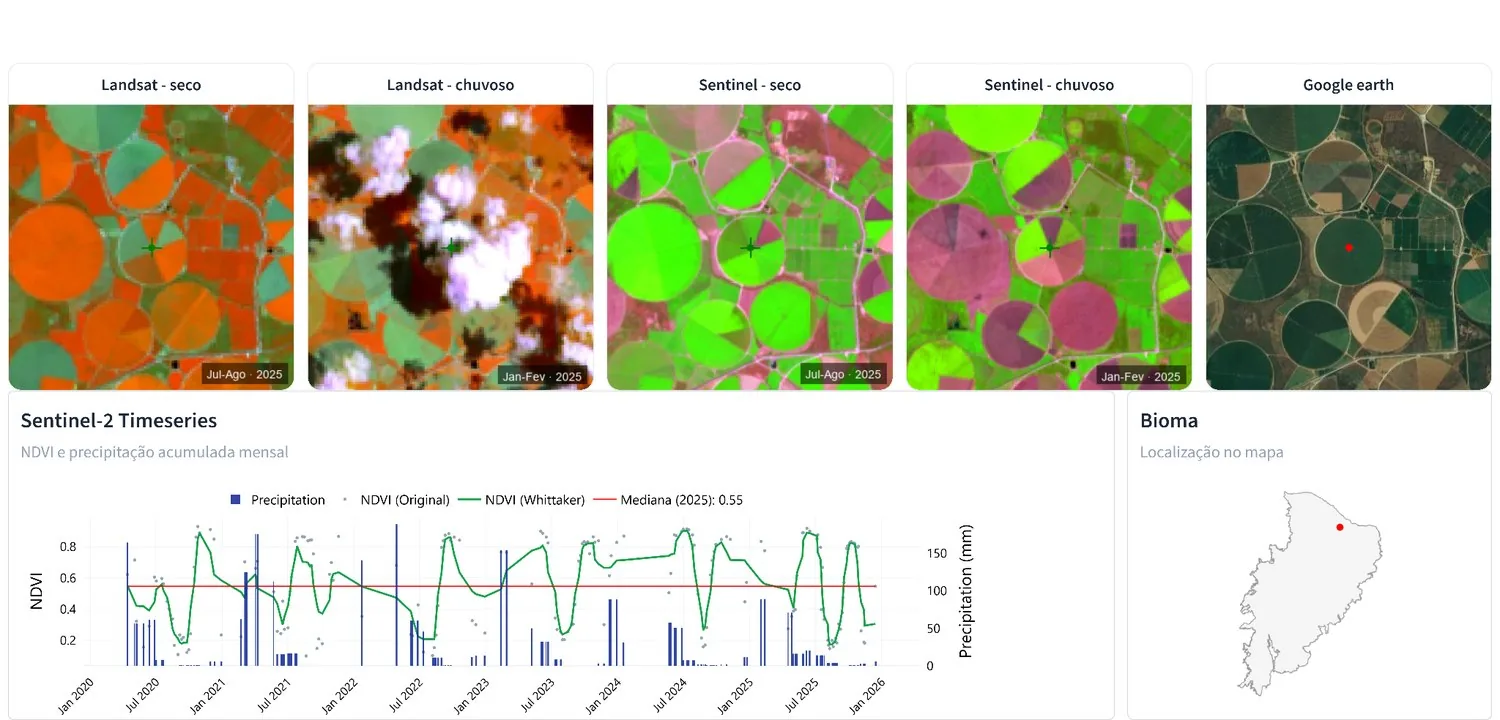
Soybean
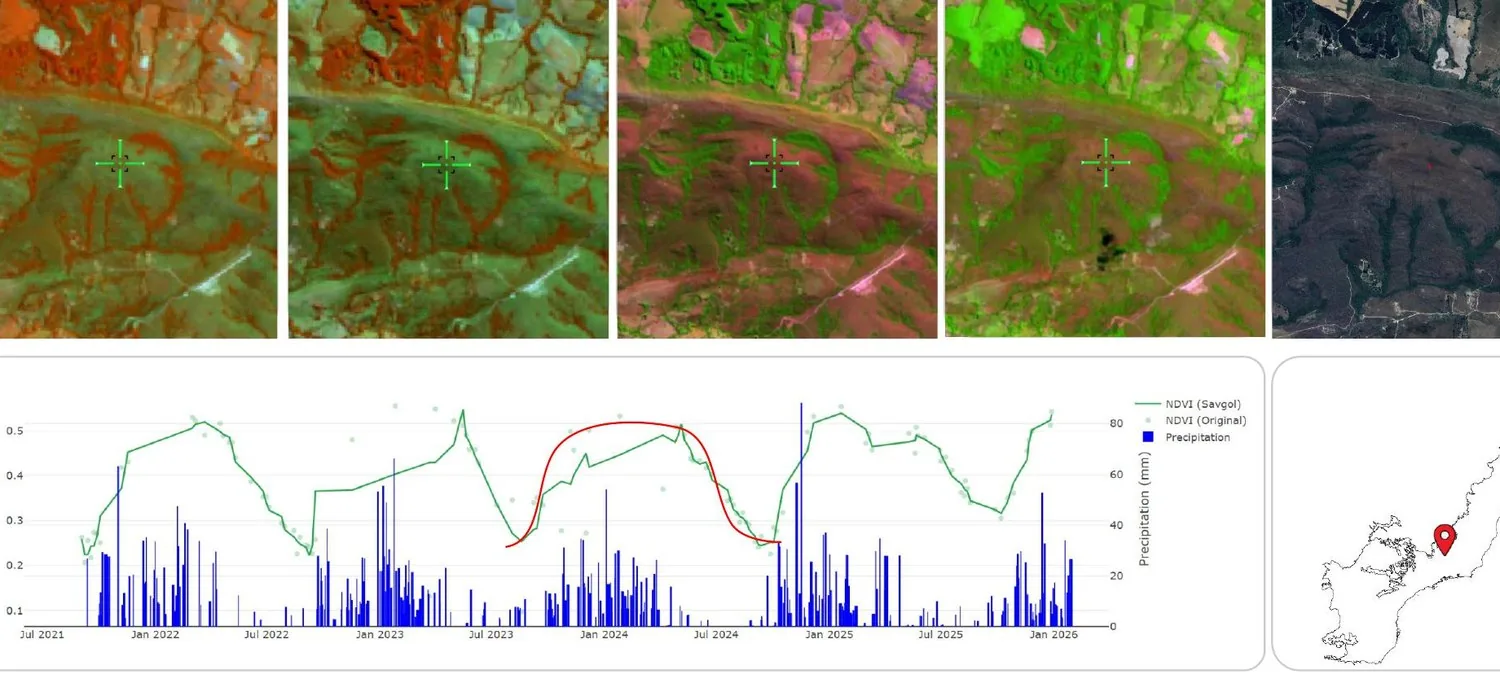
Grassland Formation
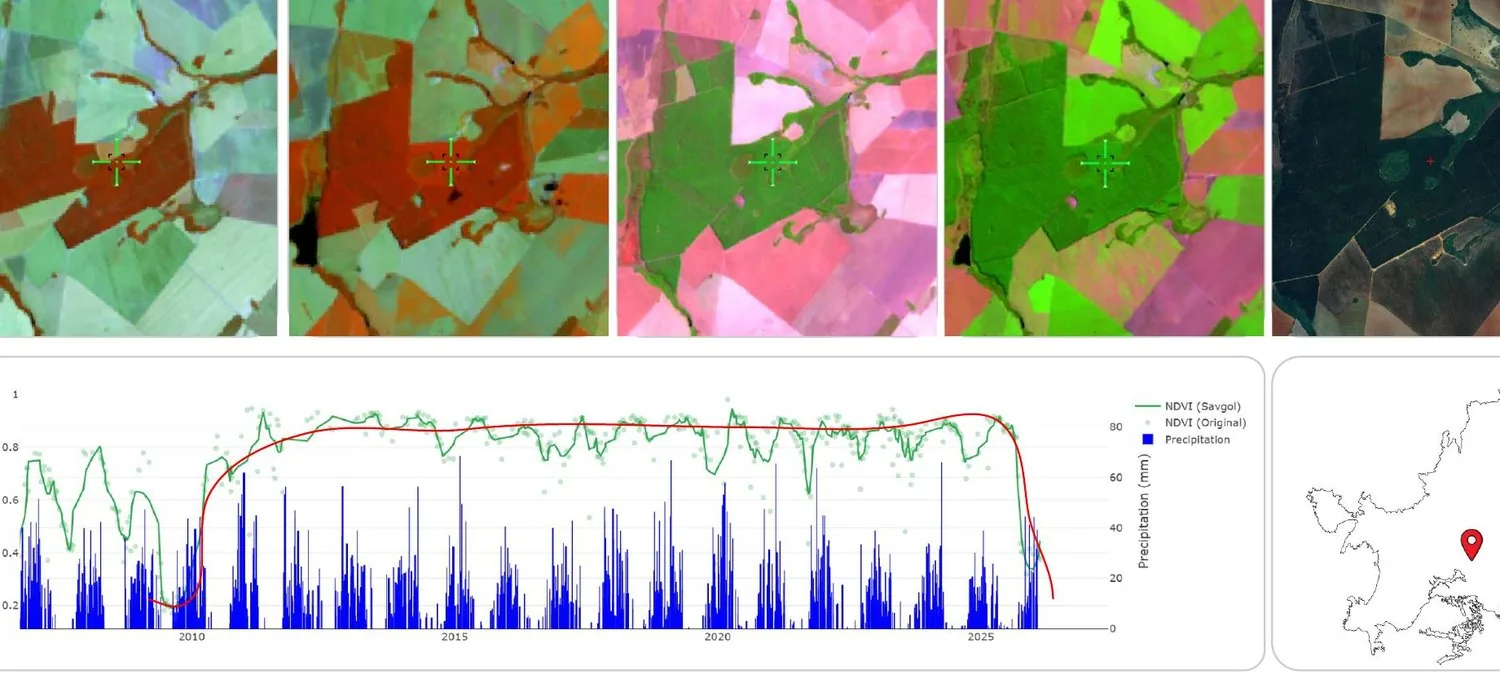
Rice
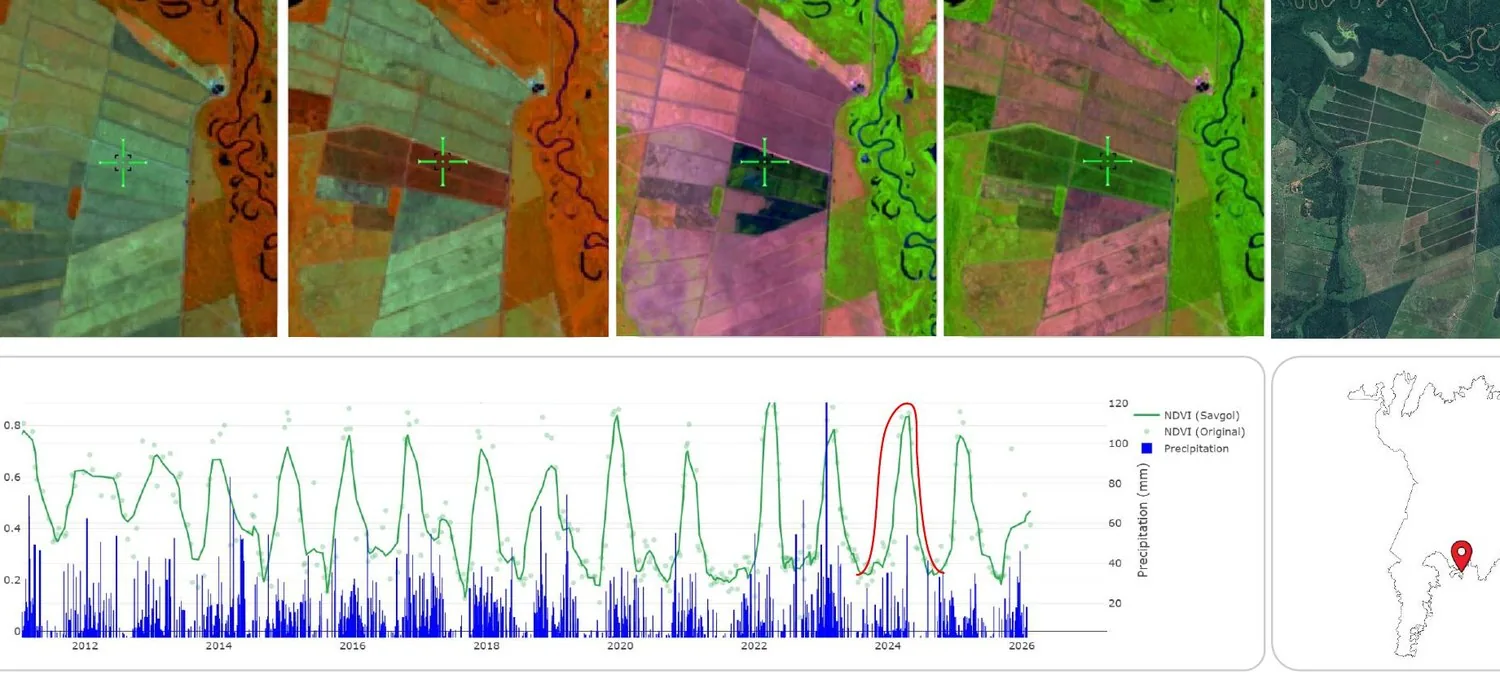
Grassland Formation
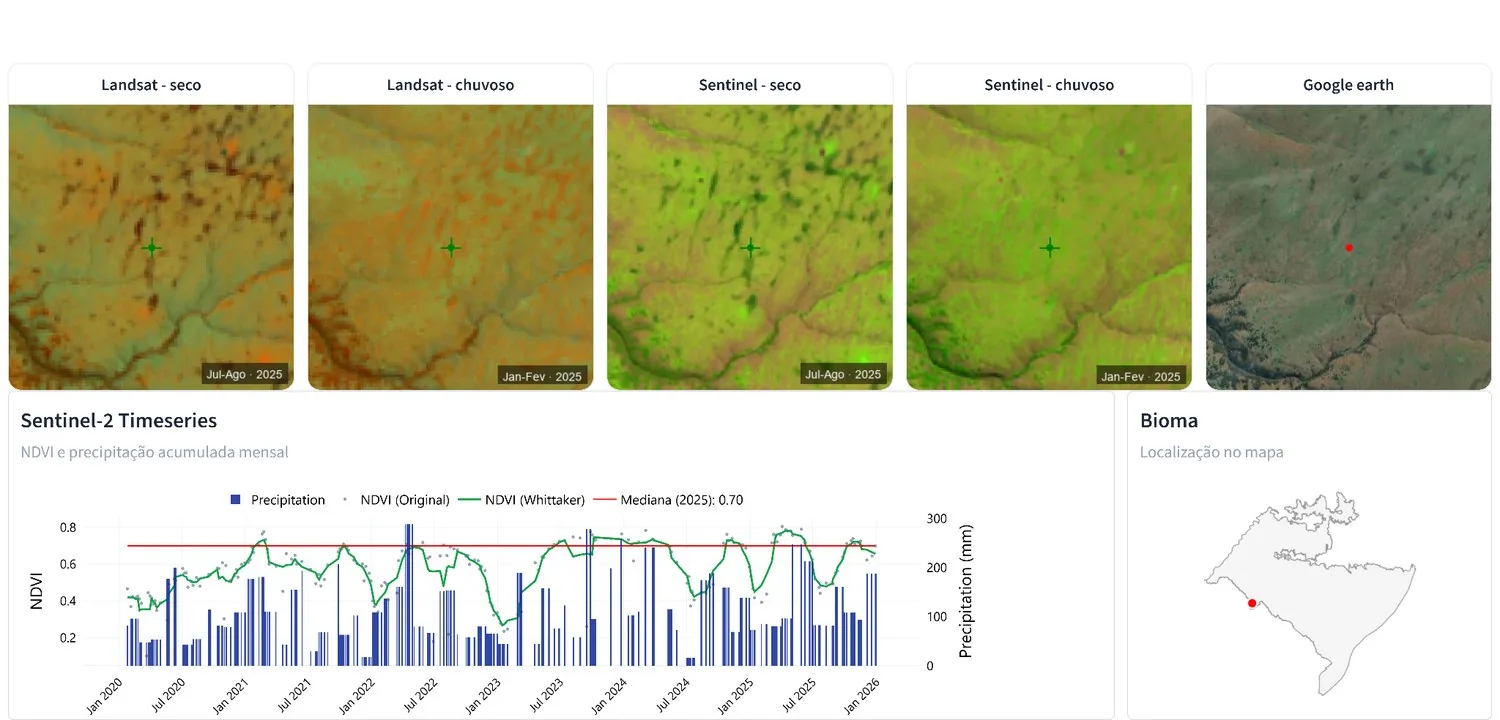
Urban Area
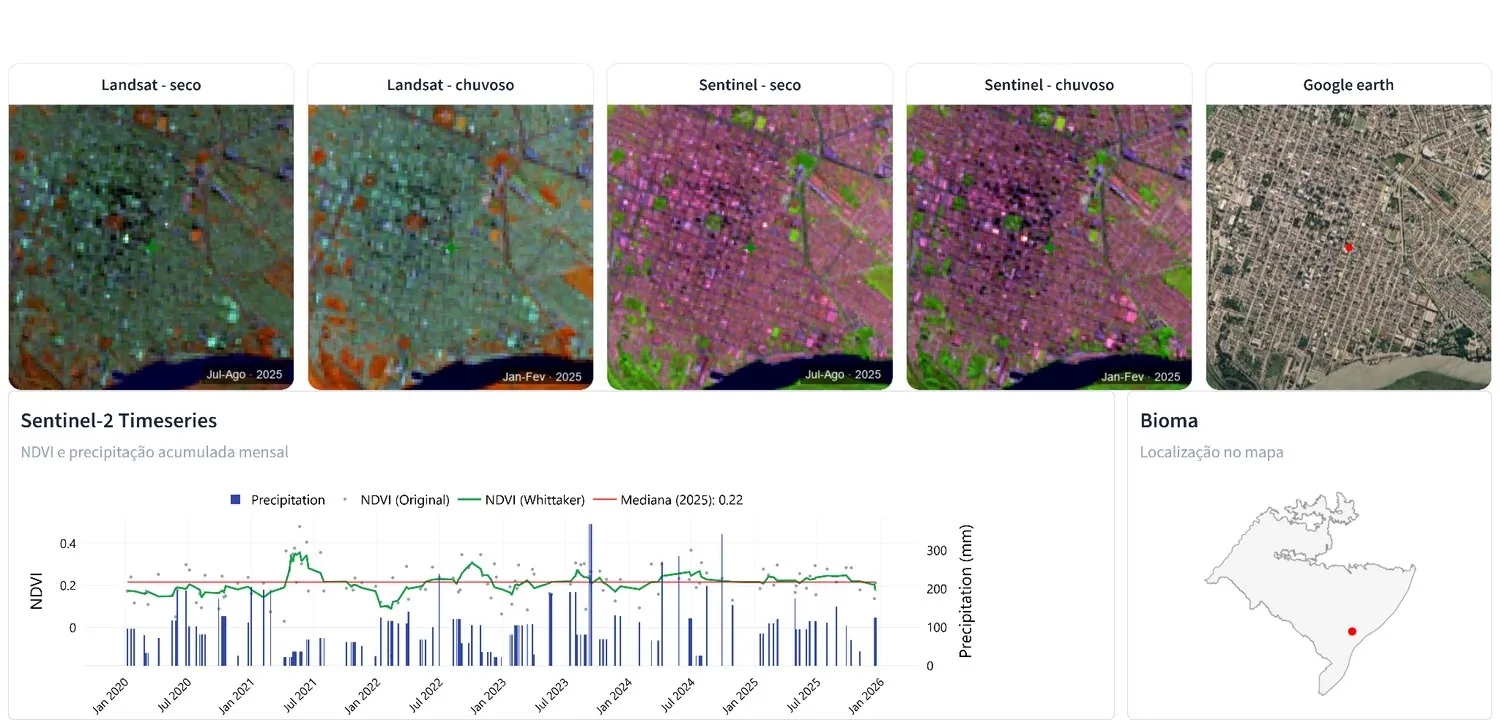
Pasture - Natural
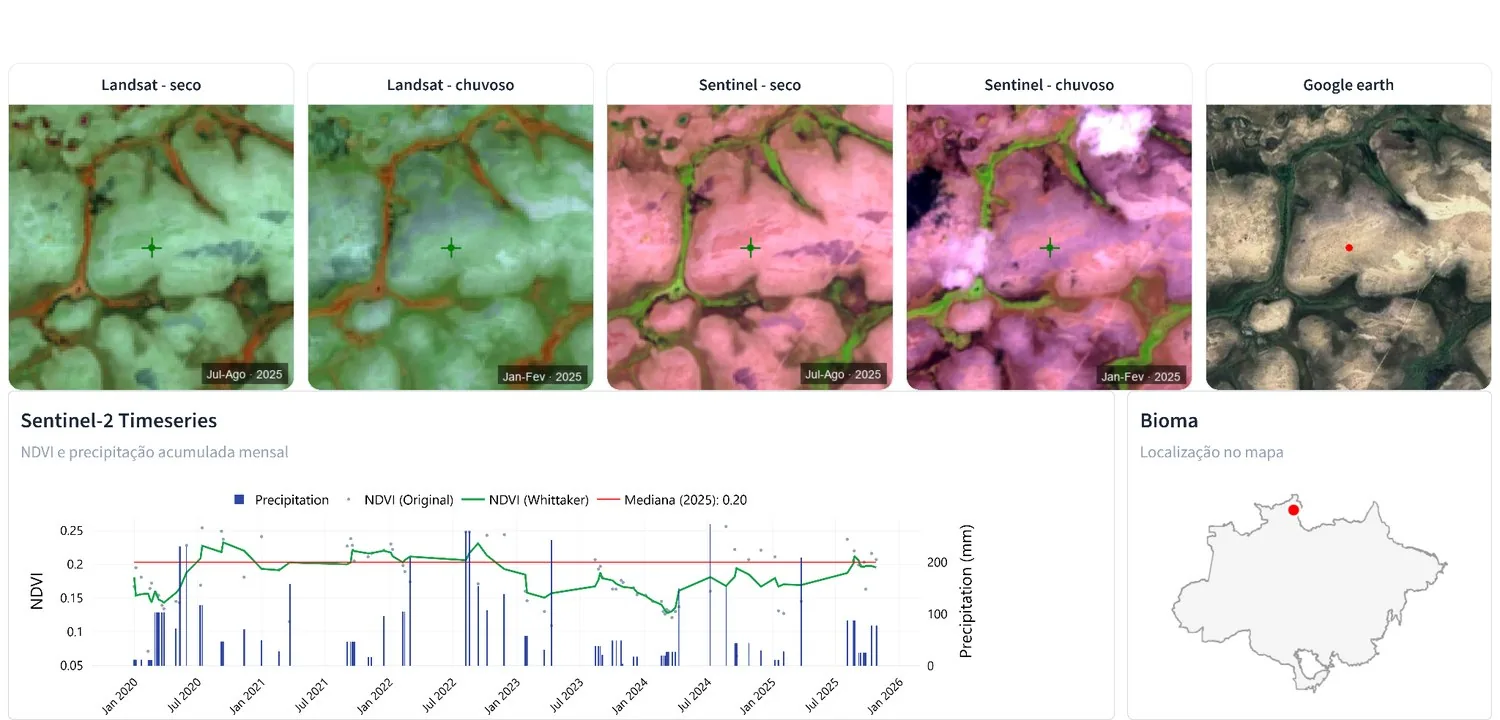
Pasture - Cultivated
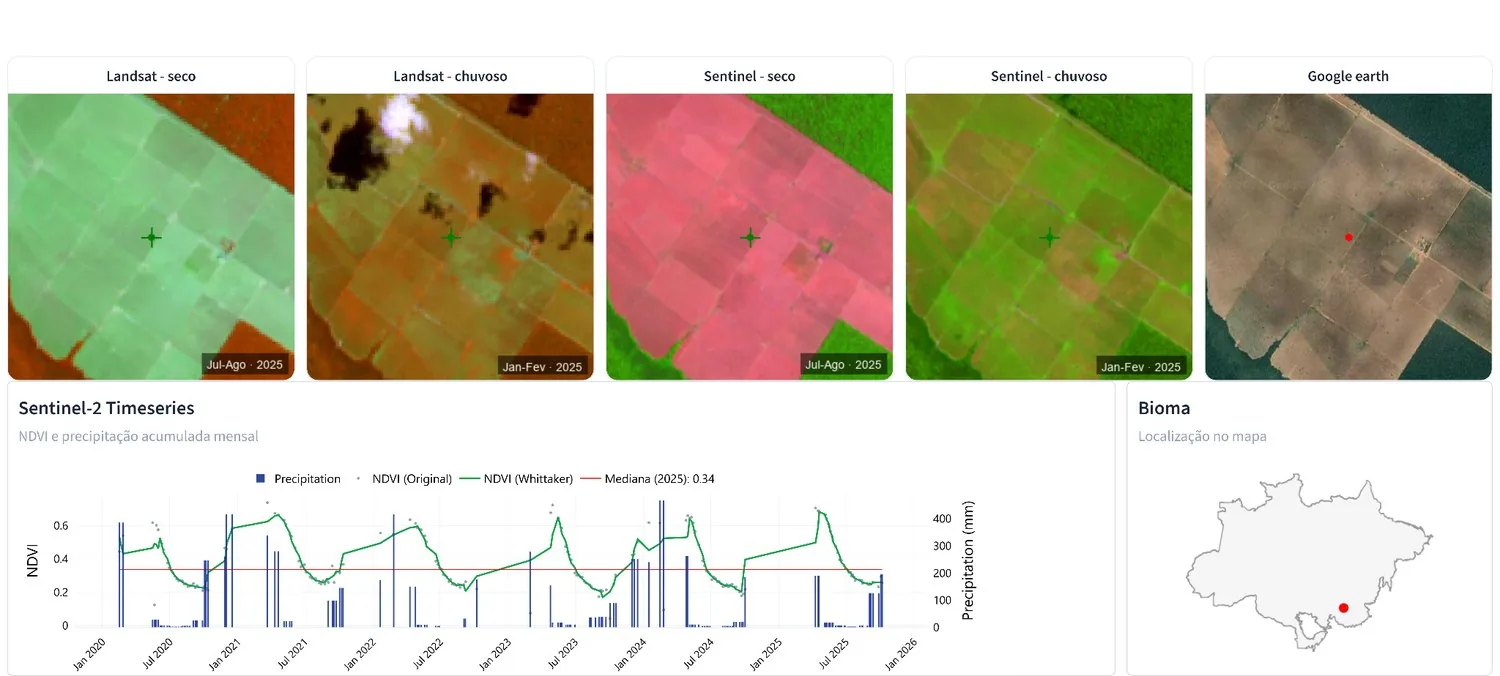
Pasture - Natural
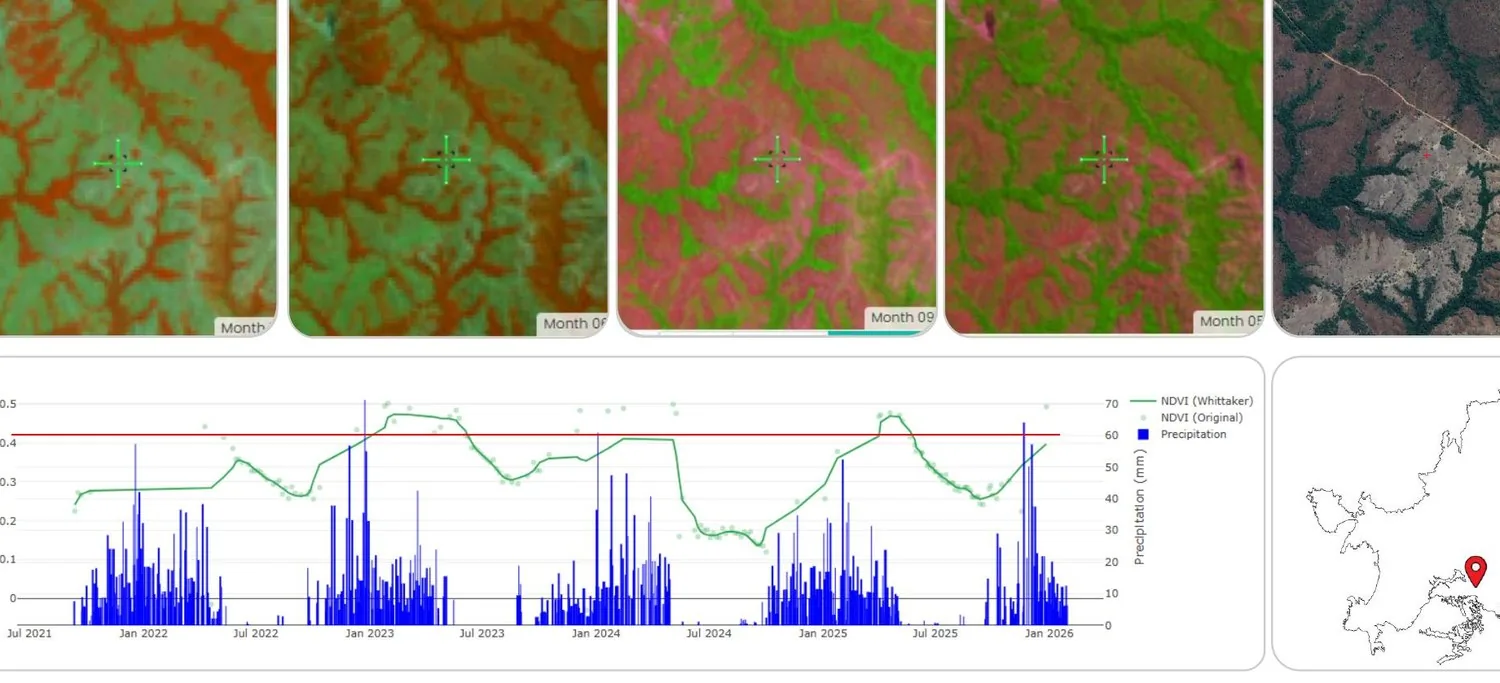
Pasture - Cultivated
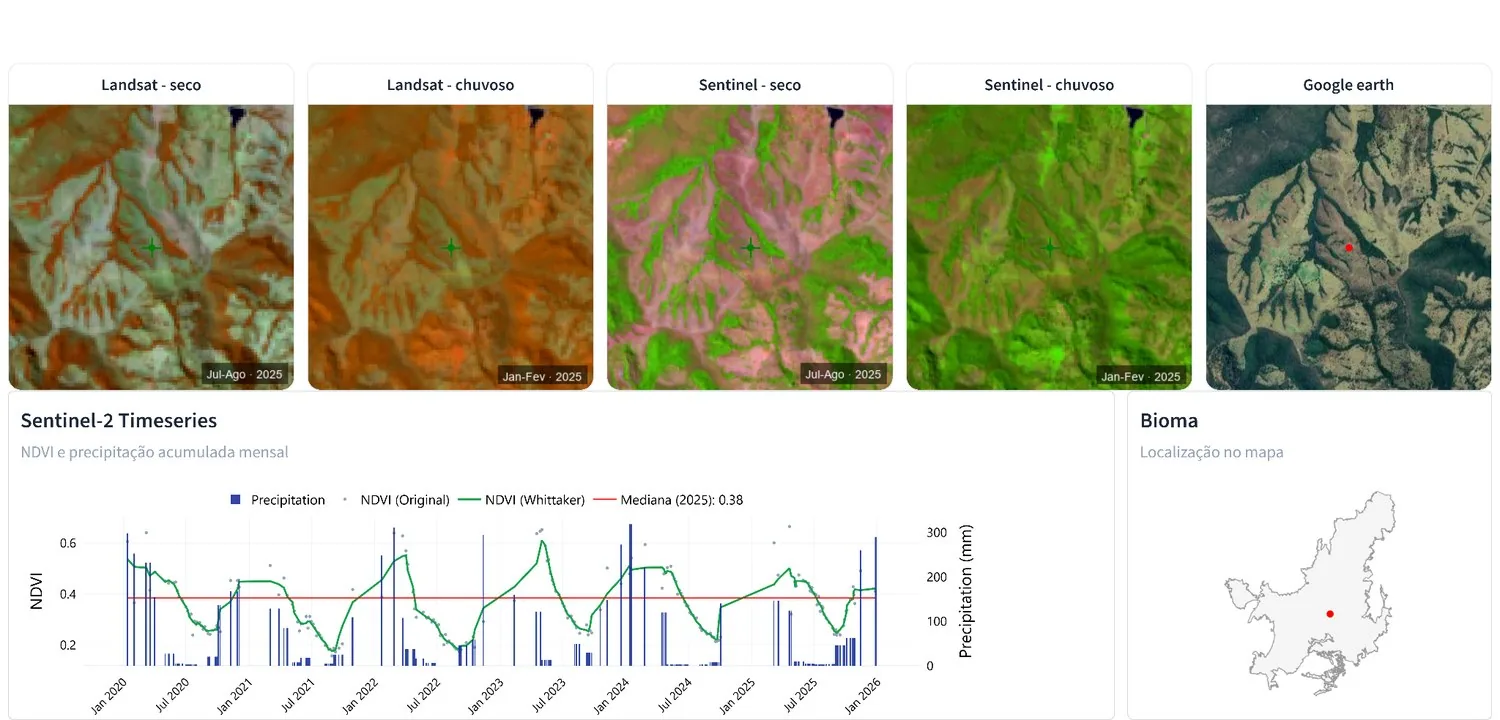
Pasture - Cultivated
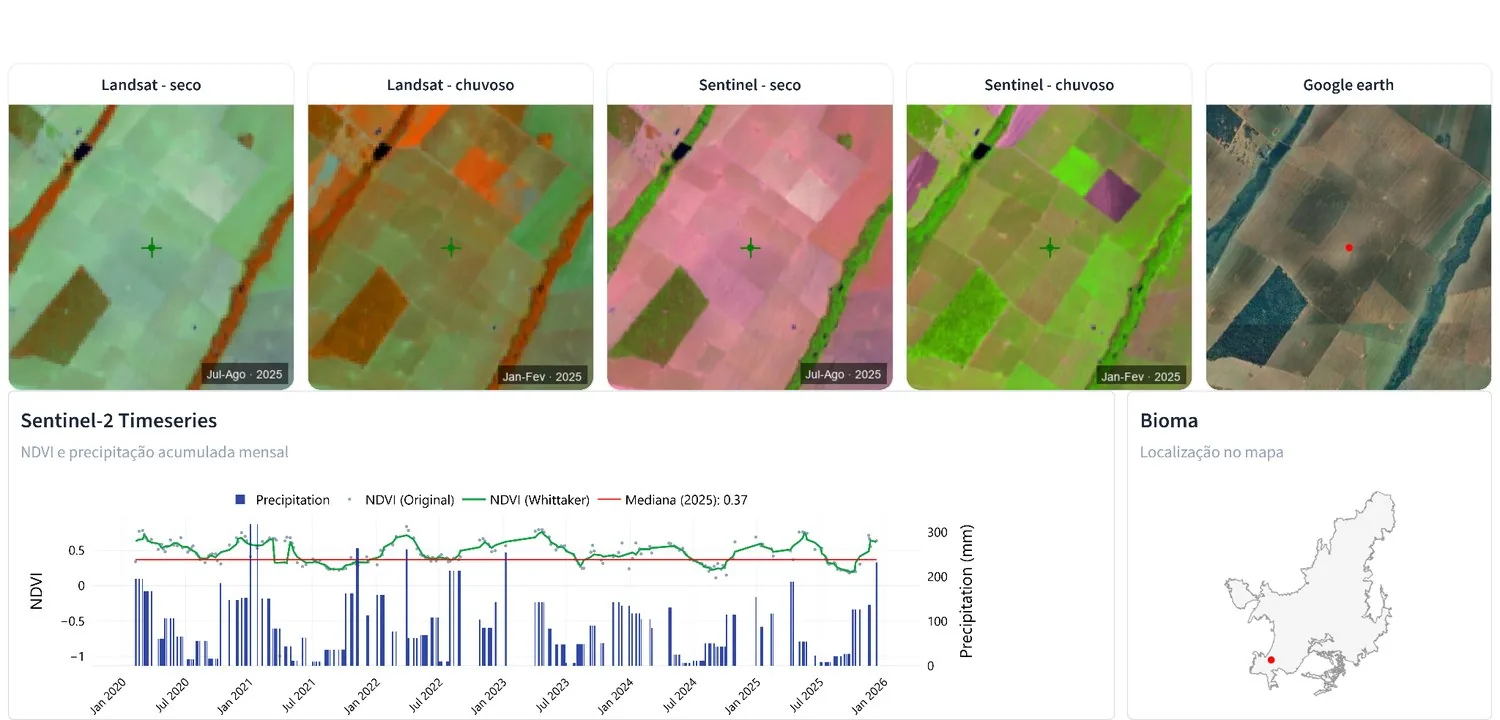
You now know how a satellite image is formed, what to observe in it, and how to differentiate classes
Next step: put it all into practice with real examples.